Contents
ONLINE CONDITION MONITORING NETWORK FOR CRITICAL EQUIPMENT AT HOLCIM’S
STE. GENEVIEVE PLANT
By: Moheb Y. Loutfi, Reliability Engineer, Holcim

TO Download Manuals about Cement kiln Maintenance & excel sheet for all costs in cement plant + most important 26 Books in cement industry click here
ABSTRACT
This paper describes a network architecture for remote monitoring and fault detection of critical rotating equipment. Holcim’s Sphinx Monitoring System (SMS) is intended for equipment protection and early prediction of machine defects. SMS is based on a server-client model, where the server maintains a database of equipment configurations and evaluates each target with a unique set of rules that monitor the equipment’s function and its integrated components’ failure modes. Adaptive software algorithms monitor process and operational changes to tune the analysis criteria for evaluating vibration signals and detecting common machine faults. Network structure, software algorithms and other aspects of the system are further discussed and evaluated against samples of collected data, generated analysis results and physical inspections’ outcomes.
INTRODUCTION
Since the rise of online condition monitoring and the continuous development of sophisticated competitive systems, the challenge has always been in how to select the most cost efficient system that best suits the application, while seamlessly integrating within the existing automation infrastructure and successfully satisfying the system’s main purpose of equipment protection and fault diagnosis. This can be quite a dilemma, especially when the online network is required to cover a wide variety of special applications within the same facility.
Standardization of industrial solutions and procedures is typically of utmost importance to global organizations. However, realistically what governs the selection of the automation and SCADA system utilized is usually the resources, technical support and other competitive advantages available in each market. This introduces another level of difficulty in selecting the optimum monitoring system, as compatibility between the different online systems and automation solutions vary greatly between suppliers.
Holcim’s in-house developed SMS was designed and implemented to address the above concerns. Its modular design allows for monitoring different applications effectively, while its open architecture permits direct integration with multiple platforms. The developed solution uses “off the shelf” hardware, to ensure availability, robustness, reliability and full compliance with industrial standards. Furthermore, custom-made software, which provides seamless integration within Holcim’s different IT Infrastructures, supplies all technical and analytical results required for monitoring and diagnosing critical equipment condition.
SYSTEM OVERVIEW
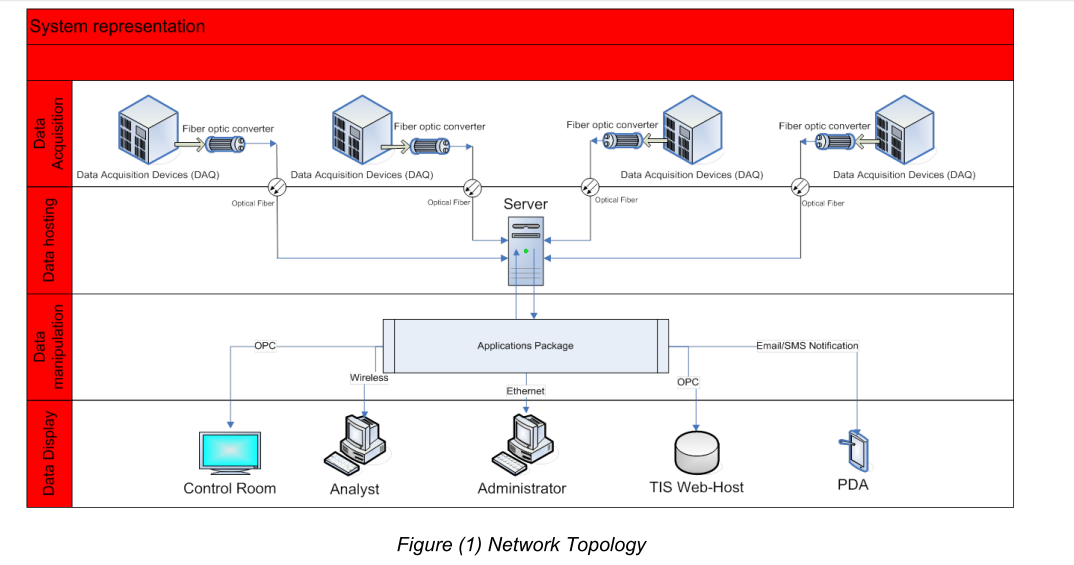
The system is an intelligent condition monitoring system that dynamically adapts to operational changes while utilizing vibration spectrum and waveform analysis to track mechanical and electrical defects. The network structure, represented in figure (1), shows how raw data is periodically stored and continuously analyzed to extract Key Performance Indicators (KPIs), which are archived in a database for trending and correlation. Select KPIs and alarms are then communicated to the Process Control System (PCS) and Technical Information System (TIS) via OLE for Process Control (OPC), for protection and condition monitoring purposes.
SYSTEM METHODOLOGY
The system architecture, employing the data flow symbolized in figure (2), applies the following methodology:
1. Dynamic signals are acquired from sensors through data acquisition devices installed on equipment.
2. Signals are routed to the central server for analysis.
3. Signals are processed to generate waveforms and spectrums from accelerometers and torque sensors.
4. Server dynamically adjusts analysis criteria to adapt to operational parameters.
5. Analysis algorithms continuously perform fault detection and amplitude tracking for various mechanical and electrical defects.
6. Analysis KPIs are extracted from spectrums and waveforms.
7. KPIs are stored in a Citadel database and are exported to PCS and TIS through OPC.

ANALYSIS CAPABILITIES
The system automatically analyzes vibration spectrums, torque fluctuations, phase relations and waveforms to extract mechanical and electrical defects. Based on the following equations and relations, software algorithms are capable of detecting and tracking a wide range of defects, including:
Bearing defects:

Belt defects:

Electrical motor defects:

Fan blades and pump vanes defects:

Gear-mesh defects:


PROGRAMMING SAMPLE
This sub-program, displayed in figure (3), detects user interaction with the radar plot and determines which KPI the user clicked on. The result is then forwarded to another sub-program that extracts the database location of the KPI’s values and trends its historical data. To do this, the program divides the plot into equal wedges, then determines the coordinates of the click, subtracts them from the coordinates of the center-point of the radar, and computes the inverse tangent of this value. The value must be adjusted, based on which quadrant of the polar plot the user clicked in (because, for example, inverse tangent of 45° equals tangent of 225°). This program is written in such a way that makes it dynamic and valid for any size of radar axes (i.e. any number of monitored KPIs).

SAMPLES OF ANALYSIS RESULTS
Discussed below are three case studies, where analysis results from the online monitoring system were verified using handheld vibration monitoring equipment and visual inspections were carried out to evaluate equipment condition.
1. Finish mill process fan
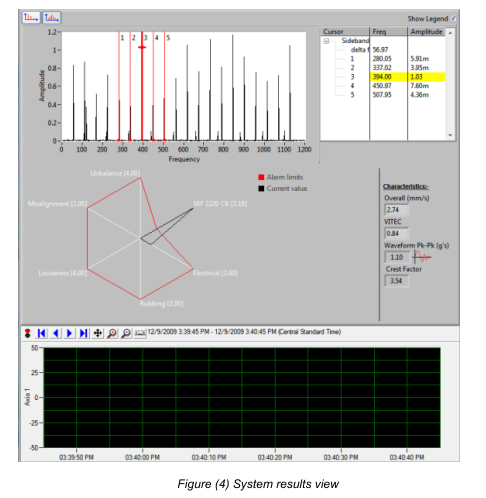
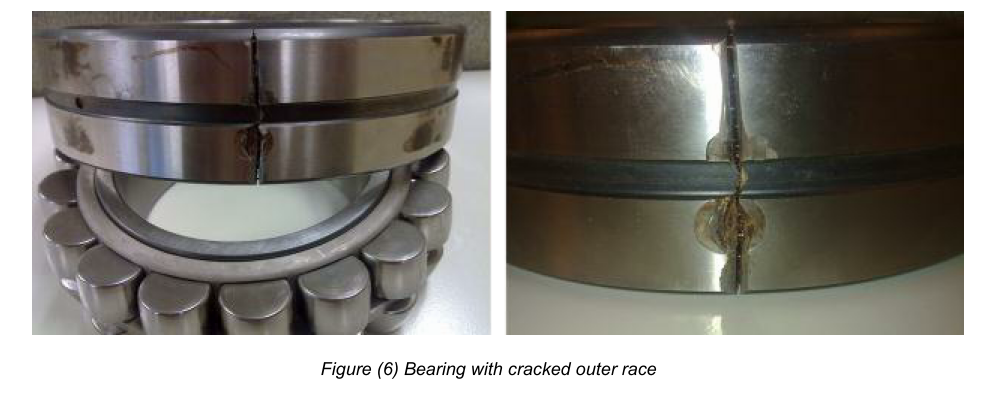
System results, presented in figure (4), displayed an alarm on the fan inboard bearing and alerted for inspection. The spectrum frequencies matched the Ball Pass Frequency Outer Race (BPFO) of the fan inboard bearing. Furthermore, comparison with the offline vibration system, displayed in figure (5), confirmed the findings. Visual inspection of the bearing, pictures displayed in figure (6), found a crack in the outer-race and prevented a catastrophic failure.
Fan bearing data:
Bearing designation: SKF 2222k
Turning speed: 441 rpm
Bearing frequencies at turning speed: BPFO=56.1 Hz, BPFI=76.2 Hz, FTF=3.12 Hz, BSF=23.3 Hz
Analysis results:
Spectrum analysis showed harmonics of BPFO and automatically allocated that to the bearing condition axis on the radar view. Furthermore, the radar view pointed out that the bearing condition fault amplitude (displayed in black) exceeded the set alarm limits (displayed in red).
Offline vibration measurements:
Route vibration measurements showed low amplitude harmonics of BPFO at 56.3 Hz in the spectrums cascade along with defined impacts in the waveforms. Hence confirming the bad bearing condition.

Inspection pictures:
2. Girth gear wear
System results, presented in figure (7), generated a gear-mesh alarm and showed increased trend of pinion/girth gear-mesh defect. Comparison with the offline vibration system, displayed in figure (8), confirmed the condition and prompted for a visual examination. Inspection discovered scuffing and high loading zones. Pictures displayed in figure (9).
Gears data:
Gears information: Pinion = 26 teeth, Girth gear = 240 teeth
Pinion Turning speed: 28 rpm
Gear-mesh frequency at turning speed: 12.18 Hz
Analysis results:
Even though the girth gear turns at 3 rpms and generates little vibration, the presence of multiple gear-mesh harmonics with low amplitudes generated a gear-mesh alarm on the radar view.
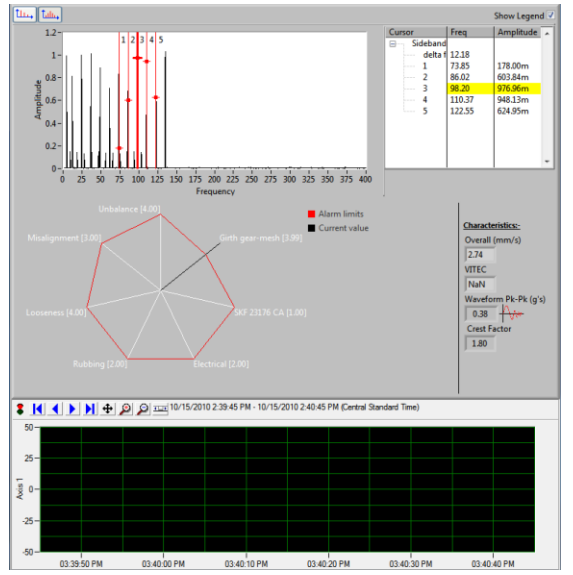
Figure (7) System results view
Offline vibration measurements:
Route vibration measurements showed low amplitude harmonics of Gear-mesh frequency at 12.18 Hz in the spectrums cascade. This confirmed the existence of an abnormal condition in the gears.
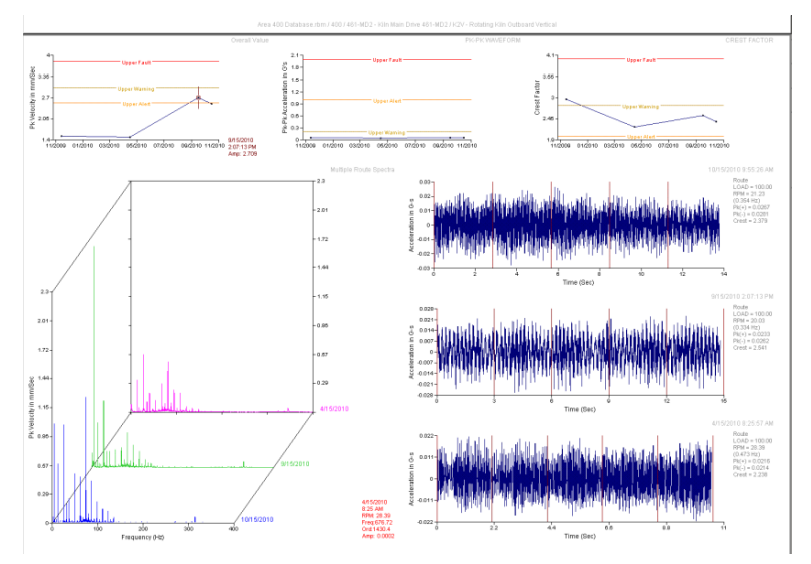
Figure (8) Offline system measurements
Inspection pictures:

3. Kiln cooler fans
System findings, shown in figure (10), detected increased looseness and rubbing signs on both inboard and outboard fan bearings of multiple cooler fans. The spectrum frequencies matched harmonics of the fan turning speed along with multiple harmonics of fractions of turning speed. Again, comparison with the offline vibration system, displayed in figure (11), confirmed the condition and prompted for a visual examination. Inspection of the bearing confirmed clear signs of rubbing and looseness on both the outer races of the bearings and the housing inner races. Pictures attached in figure (12).
Fan bearing data:
Bearing designation: Dodge 22224E1 K
Turning speed: 1800 rpm
Analysis results:
Spectrum analysis revealed harmonics of turning speed (1x) along with unsteady phase and classified that as looseness. Moreover, the harmonics of fractions of turning speed (1.25x and 1.75x), were identified as rubbing. The radar view shows looseness and rubbing exceeding the alarm limits and some electrical motor defects within alarm limits.
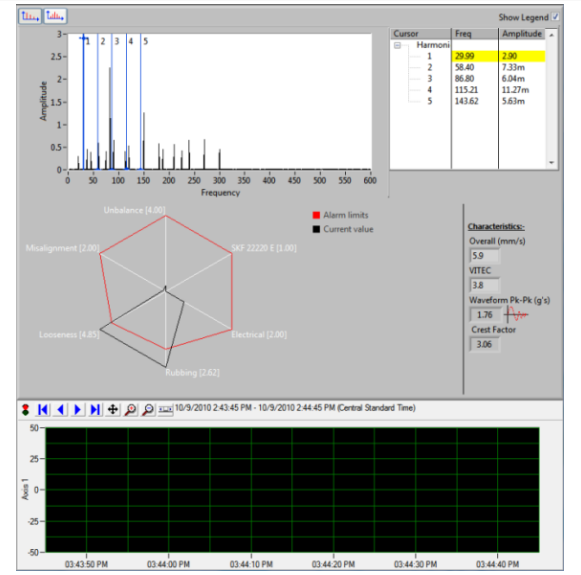
Figure (10) System results view
Offline vibration measurements:
Route vibration spectrums showed harmonics of turning speed at 30 Hz, harmonics of 37.5 Hz (1.25x) and harmonics of 52.5 Hz (1.75x) in the spectrums cascade. The condition would have been hard to diagnose without considering the cross phase measurements conducted by the online system and required advanced vibration knowledge to detect.


CONCLUSION
The system has proven to be of great benefit in multiple aspects. Having a dedicated network, separate from the process control system (PCS), allows for continuous streaming of raw data that is invaluable for post processing and analysis. Unlike other systems that extract features from raw data streams then only transmit those features to the PCS for trending, the capability of analyzing raw data can be instrumental in identifying root causes.
Furthermore, the automatic and adaptive analysis features accurately identify faults and takes on the analyst’s job of manual vibration analysis, which requires considerable technical knowledge and experience. In the meantime, it eliminates the time and effort required for data collection, which can be allocated towards other condition monitoring activities. For plants with multiple critical equipment, which require frequent monitoring and consistent analysis, it is vital to have an automated solution that is reliable.
The self-adjusting functions adapt to operational changes and process fluctuations effectively, which results in accurate diagnostics and gives the system advantage over other systems that require extra sensors to perform equally.
Nowadays it is becoming mandatory to install vibration protection systems on critical equipment, while online condition monitoring systems are still considered a luxury. However, combining protection with advanced diagnostic capabilities in one system yields enormous cost savings and improves overall reliability tremendously, therefore making the choice of a hybrid system more feasible.
Moreover, as the system was developed in-house, it integrates seamlessly with the different control systems utilized by the company worldwide. Compared to available market solutions, while the system is still under development to provide more elegant displays and user interface functionality, it has demonstrated to be more cost efficient, reliable and effective in equipment protection and diagnostics.
REFERENCES
1. Machinery Vibration Analysis- Volume II: Analysis and Correction. Vibration Institute. Rolling Element Bearing Analysis. PP 11.11
2. Intermediate Vibration Analysis. Rev 01/07. Emerson Process Management. Belts-Defect Characteristics. PP 14.4
3. Machinery Vibration Analysis- Volume II: Analysis and Correction. Vibration Institute. Motors. PP 14.1-14.30
4. Machinery Vibration Analysis- Volume II: Analysis and Correction. Vibration Institute. Centrifugal machines. PP 13.8
5. Intermediate Vibration Analysis. Rev 01/07. Emerson Process Management. Gears – Gearbox Defect Characteristics. PP 12.10-12.20
6. Machinery Vibration Analysis- Volume I: Diagnostic Techniques. Vibration Institute. Orbital and Phase Analysis. PP 5.22
TO Download Manuals about Cement kiln Maintenance & excel sheet for all costs in cement plant + most important 26 Books in cement industry click here