Most Complete & Professional for CO2 in Cement industry , last sheet you will download| perfect
CLICK HERE NOW TO DOWNLOAD MOST IMPORTANT BOOKS IN CEMENT INDUSTRY + PRACTICAL EXCEL SHEETS TO HELP YOU IN YOUR DAILY WORK
TO download the excel sheet click here
“WBCSD Cement Sustainability Initiative
CO2 Emissions Inventory Protocol, Version 2.0” Colour Codes, Notes & FAQ
Subject Numbers / Values
Basic information on plant and company Input cell; value to be entered by Cement Company
Calculation of CO2 emissions, and emission rights Calculated value
Calculation of Performance indicators, Total absolute and specific emissions Self-calculating value from another part of the Worksheet
Default value, to be corrected by Cement Company if more precise data are available
Notes to the user:
– PLANT Worksheet: All empty white cells must be completed. If an input value is zero (0), do not leave the cell blank but enter zero.
– COMPANY Worksheet: Consolidated totals must be entered manually in all white “SUM” cells. If a value is zero (0), do not leave the cell blank but enter zero.
– Non-input cells are write-protected to prevent inadvertent changes. To change them (e.g., formulas), remove protection of worksheet (Menu: EXTRA).
To prevent changing of protected cells by other users, a password may be entered (Menu: EXTRA).
– The worksheets contain columns for the Years 2005-2015 to allow for scenario analysis. To show / hide these columns, click the “+” / “-” buttons above Column AF.
Frequently Asked Questions:
– Question: “Why do many self-calculating cells in my worksheet display a calculation error (for example, “#VALUE” displayed)?
Answer: “#VALUE” appears as long as some necessary input cells have not been completed (i.e., some cells have been left blank).
Generally, a value must be entered in all white input cells. Enter 0 (zero) if a value is zero or if an item is not applicable. Do not leave input cells blank.
Some critical cells that are easily overlooked include: Lines 115-123 and 145-153 (consumption and heating values of biomass fuels); lines 301-304 and 311-314
(consumption and heating values of non-kiln fuels), and line 403 (credits for alternative fossil fuels, which are necessary for calculating net emissions).
– Question: Why is there a column for the Year 2015?
Answer: There are columns for all years up to 2015 to allow for scenario analysis; however, columns for 2005-14 are hidden by default. To hide the 2015 column,
right-click column head and select “Hide” from the context menu, or use “+”/”-” buttons above Column AF.
– Question: What is the purpose of the grey “1”- and “2”-buttons in the top left corner of the screen?
Answer: These buttons serve to hide (1) and show (2) grouped rows and columns. Grouped rows include lines 65a-77, and lines 401-426.
Grouped columns include those for Years 2005-15. To change groups, use menu DATA ==> Groups.
“WBCSD Cement Sustainability Initiative
CO2 Emissions Inventory Protocol, Version 2.0” Plant Level – Comments
Date of latest update 18/ Jan/ 2005
CLICK HERE NOW TO DOWNLOAD MOST IMPORTANT BOOKS IN CEMENT INDUSTRY + PRACTICAL EXCEL SHEETS TO HELP YOU IN YOUR DAILY WORK
INFORMATION
General Plant Information 1990 1991 1992 1993 1994 1995 1996 1997 1998 1999 2000
1 Plant
2 Company
3 Country
4 Continent
5 “Kyoto” Region (Annex 1 or non-Annex 1)
6 Kiln types
7 Shares owned by Company [%]
Inventory Boundaries: Coverage of Main Process Steps 1990 1991 1992 1993 1994 1995 1996 1997 1998 1999 2000
7a Raw material supply (quarrying, mining, crushing) [yes, no or n.a.] “Yes” means that energy consumption and emissions data for the project step are reported
7b Preparation of raw materials, fuels and additives [yes, no or n.a.] “No” means that emissions are generated as a result of the process step, but the data are not reported — Needs
7c Kiln operation (pyro-processing) [yes, no or n.a.] explanation in a note in the cell for why “No” was used.
7d Cement grinding, blending [yes, no or n.a.] “n.a.” (not applicable) means that emissions are never generated from this source, or the source does not exist at this plant.
7e On-site (internal) transport [yes, no or n.a.] See Guide to Protocol, Appendix 3, for details on the different process steps.
7f Off-site transport with company-owned fleets [yes, no or n.a.]
7g On-site power generation [yes, no or n.a.]
7h Room heating / cooling [yes, no or n.a.]
7h (add other process steps as appropriate) [yes, no or n.a.]
Clinker and Cement Production 1990 1991 1992 1993 1994 1995 1996 1997 1998 1999 2000
Clinker:
8 Clinker production [t/yr] Actual clinker production of active kilns
9 Clinker bought [t/yr] Amount of clinker purchased from other plants or companies. See Section 7.3 of guidance document for details on company-internal transfers.
10 Clinker sold [t/yr] Amount of clinker sold to other plants or companies. See Section 7.3 of guidance document for details on company-internal transfers.
10a Change in clinker stocks [t/yr] Amount of clinker added to stocks (positive sign) or taken from stocks (negative sign).
11 Total clinker consumed [t/yr] =Line8 + line9 – line10 – line10a
Mineral components (MIC) used to produce Portland and blended cements:
12 Gypsum [t/yr, dry weight] Only mineral components used for portland cement and blended cement, excl. MIC used for slag cement production
13 Limestone [t/yr, dry weight] idem
14 Slag [t/yr, dry weight] idem
15 Fly ash (for blending) [t/yr, dry weight] idem
16 Puzzolana [t/yr, dry weight] idem
17 Others (e.g., CKD added to cement mill) [t/yr, dry weight] idem
18 Total MIC consumed for Portland and blended cements (dry weight) [t/yr, dry weight] =SUM (line12:line17)
Mineral components (MIC) used as cement substitutes (direct additions to concrete):
19a MIC consumed for production of pure slag cement [t/yr, dry weight] This is pure ground slag cement, containing no clinker
19b Fly ash and puzzolana (direct sales) [t/yr, dry weight] This is pure fly ash and puzzolana, sold directly to consumers for production of concrete
19 Total pure MIC products used as cement substitutes [t/yr, dry weight] =SUM (line19a:line19b)
Production totals:
20 Total Portland + Blended cements [t/yr] “Total cement produced (all types together except pure slag cement and direct fly ash sales);
= line11 + line18”
21 Total cements + substitutes: Portland, Blended, Slag [t/yr] “= Total cements produced, exclusive clinker sold to third parties
= Portland + Blended + Slag cements incl. direct fly ash sales; = line11 + line18 + line19”
21a Total cementitious products [t/yr] “= Total clinker produced plus MIC consumed for blending or production of cement substitutes;
=line8 + line18 + line19”
Dust Production (dry weight) 1990 1991 1992 1993 1994 1995 1996 1997 1998 1999 2000
22 Bypass dust leaving kiln system [t/yr, dry weight] Only bypass dust which leaves the kiln system, e.g. for landfilling.
23 CKD leaving the kiln system [t/yr, dry weight] “All CKD which leaves the kiln system, e.g. for additions to cement mill, direct sale, landfilling, etc.
CKD volumes added to cement mill should also be entered in line 17. CKD sold directly as a product may be entered in line 19b.”
24 Calcination rate of CKD [%] Default = 100%. To be replaced with more precise data by Company if available. See Guide to Protocol, Appendix 4 for instructions.
Kiln Fuel Consumption (Aggregate) 1990 1991 1992 1993 1994 1995 1996 1997 1998 1999 2000
25 Total heat consumption of kilns [TJ/yr] Sum of conventional fossil fuels, alternative fossil fuels, and biomass fuels; =SUM (line26:28)
26 Conventional fossil fuels [TJ/yr] Calculated based on consumption of individual fuels and their lower heating values; = line161
27 Alternative fossil fuels [TJ/yr] Calculated based on consumption of individual fuels and their lower heating values; = line168
28 Biomass fuels [TJ/yr] Calculated based on consumption of individual fuels and their lower heating values; = line175
Non-Kiln Fuel Consumption 1990 1991 1992 1993 1994 1995 1996 1997 1998 1999 2000
30 Equipment and on-site vehicles [TJ/yr] Fuel used for quarry equipment and vehicles for internal transport; =line321
31a Room heating / cooling [TJ/yr] Fuel used for office heating; =line322
31b Drying of raw materials and mineral components [TJ/yr] Fuel used for drying of raw materials and mineral components; =line 323
31c On-site power generation [TJ/yr] Fuel used for power generation on site (autoproduction); =line324
32 Total non-kiln fuel consumption [TJ/yr] =SUM (line30:line31c)
Power Consumption 1990 1991 1992 1993 1994 1995 1996 1997 1998 1999 2000
33a Consumption of power produced on-site [MWh/yr] Consumption of power produced on site (= from autoproduction)
33b CO2 per power unit produced on-site [kg CO2/MWh] “Calculated based on CO2 from on-site power generation and amount of power produced on-site;
= line45c / line33a * 1000; “”n. appl.”” = not applicable”
33c Consumption of power produced externally [MWh/yr] Consumption of grid power
33d CO2 per power unit produced externally [kg CO2/MWh] Specific CO2 emission per unit grid power, to be obtained from power supplier or national authorities
33 Total plant power consumption [MWh/yr] =(line33a + line33c)
Waste Heat Exports 1990 1991 1992 1993 1994 1995 1996 1997 1998 1999 2000
34 Waste heat supplied to external consumers [GJ/yr] Waste heat exported to third parties
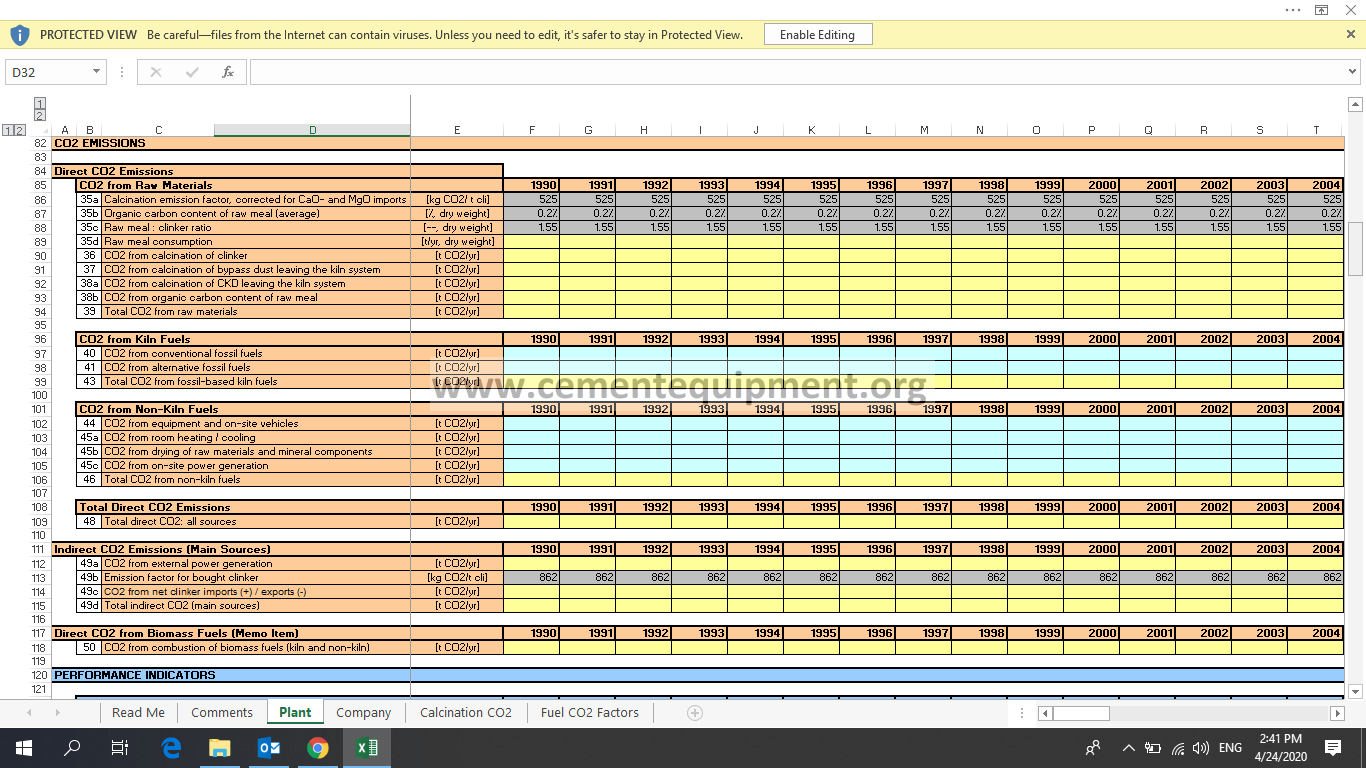
CO2 EMISSIONS
Direct CO2 Emissions
CO2 from Raw Materials 1990 1991 1992 1993 1994 1995 1996 1997 1998 1999 2000
35a Calcination emission factor, corrected for CaO- and MgO imports [kg CO2/ t cli] Default set equal to 525 kg CO2/ t clinker. To be replaced with more precise data by Company if available (see auxiliary sheet “Calcination CO2”)
35b Organic carbon content of raw meal (average) [%, dry weight] Default set equal to 0.2%. To be replaced with company-specific data if raw materials with substantially higher or lower content of organic carbon are used. See Guidance document for details.
35c Raw meal : clinker ratio [–, dry weight] Default set equal to 1.55. To be replaced with company-specific data (excluding fuel ash content) if organic carbon in raw materials is of relevance. Any dust leaving the kiln system should be reflected in this ratio. Ash content of fuels should be excluded.
35d Raw meal consumption [t/yr, dry weight] “Calculated from the raw meal : clinker ratio and the amount of clinker produced;
=line35c * line8. Raw meal converted to CKD is included in the raw meal to clinker ratio.”
36 CO2 from calcination of clinker [t CO2/yr] “Calculated from the calcination emission factor and the clinker production;
=line35a / 1000 * line8”
37 CO2 from calcination of bypass dust leaving the kiln system [t CO2/yr] “Calculated from the calcination emission factor and the amount of bypass dust leaving the kiln system (e.g. for landfilling);
=line35a / 1000 * line22”
38a CO2 from calcination of CKD leaving the kiln system [t CO2/yr] Calculated from the calcination emission factor, the amount of CKD leaving the kiln system (e.g. for landfilling or sale), and the calcination rate of CKD; =line23 * non-linear function of lines 35a and 24; see Guidance document for details on formula
38b CO2 from organic carbon content of raw meal [t CO2/yr] “Calculated from the organic carbon content of raw meal, the raw meal consumption, and the CO2 to C molar weight ratio;
=line35b * line35d * 3.664 ”
39 Total CO2 from raw materials [t CO2/yr] =SUM (line36:line38b)
CO2 from Kiln Fuels 1990 1991 1992 1993 1994 1995 1996 1997 1998 1999 2000
40 CO2 from conventional fossil fuels [t CO2/yr] Sum of CO2 emissions from conventional fossil fuels, = line211
41 CO2 from alternative fossil fuels [t CO2/yr] Sum of CO2 emissions from alternative fossil fuels, = line218
43 Total CO2 from fossil-based kiln fuels [t CO2/yr] =SUM (line40:line41)
CO2 from Non-Kiln Fuels 1990 1991 1992 1993 1994 1995 1996 1997 1998 1999 2000
44 CO2 from equipment and on-site vehicles [t CO2/yr] Sum of CO2 emissions from equipment and on-site vehicles; =line331
45a CO2 from room heating / cooling [t CO2/yr] Sum of CO2 emissions from room heating and cooling; =line332
45b CO2 from drying of raw materials and mineral components [t CO2/yr] Sum of CO2 emissions from drying of raw materials and mineral components; =line333
45c CO2 from on-site power generation [t CO2/yr] Sum of CO2 emissions from on-site power generation (excl. biomass CO2); =line334
46 Total CO2 from non-kiln fuels [t CO2/yr] =SUM (line44:line45c)
Total Direct CO2 Emissions 1990 1991 1992 1993 1994 1995 1996 1997 1998 1999 2000
48 Total direct CO2: all sources [t CO2/yr] = line39 + line43 + line46
Indirect CO2 Emissions (Main Sources) 1990 1991 1992 1993 1994 1995 1996 1997 1998 1999 2000
49a CO2 from external power generation [t CO2/yr] = line33c * line33d / 1000
49b Emission factor for bought clinker [kg CO2/t cli] = Default is 862 kg CO2 /t clinker. This represents an average of several cement companies represented in CSI. Using this default consistently across different plants ensures that company-internal clinker transfers cancel out when consolidating emissions.
49c CO2 from net clinker imports (+) / exports (-) [t CO2/yr] Calculated by multiplying net clinker imports (= clinker bought minus clinker sold) by the default emission factor for bought clinker; = (line9 – line10) * line49b / 1000. Value will be negative if plant is net exporter of clinker.
49d Total indirect CO2 (main sources) [t CO2/yr] = line49a + line49c
Direct CO2 from Biomass Fuels (Memo Item) 1990 1991 1992 1993 1994 1995 1996 1997 1998 1999 2000
50 CO2 from combustion of biomass fuels (kiln and non-kiln) [t CO2/yr] Direct CO2 emissions from combustion of kiln and non-kiln biomass fuels; =line225 + line334e
PERFORMANCE INDICATORS
Gross CO2 Emissions (= total direct CO2; all sources) 1990 1991 1992 1993 1994 1995 1996 1997 1998 1999 2000
59 Absolute gross CO2 [t CO2/yr] “Total direct emissions from raw materials, kiln fuels and non-kiln fuels;
=line39 + line43 + line46”
59a raw material component [t CO2/yr] “Direct emissions from raw materials;
=line39”
59b fuel component [t CO2/yr] “Direct emissions from kiln fuels and non-kiln fuels;
=line43 + line46”
60 Specific gross CO2 per tonne of clinker produced [kg CO2/t cli] “Total direct emissions, divided by own clinker production;
=line59 / line8”
62 tonne of cementitious product [kg CO2/t cem prod] “Total direct emissions, divided by own production of cementitious products (excluding bought clinker in cement);
=line59 / line21a”
62a raw material component [kg CO2/t cem prod] “Direct emissions from raw material calcination, divided by own production of cementitious products;
=line59a / line21a”
62b fuel component [kg CO2/ cem prod] “Direct emissions from kiln fuels and non-kiln fuels, divided by own production of cementitious products;
=line59b / line21a”
Acquired Emission Rights (Offsets) 1990 1991 1992 1993 1994 1995 1996 1997 1998 1999 2000
64a Question to User: Do you wish to calculate your Acquired Emission Rights and Net Emissions? If yes, are your emissions subject to a quantified target?
64b “The buttons in line 64b of the Plant and Company worksheets serve to hide and show the lines 65a-77 and lines 401-426.
Click NO if you do not wish to calculate your Acquired Emission Rights and Net Emissions.”
64c “Click YES – WITHOUT TARGET to calculate your Net Emissions, without accounting for emission rights under a quantified target. ==> Lines 401-404 and 414-417 must be completed.
Click YES – WITH TARGET to calculate your Net Emissions and determine compliance with your quantified target. ==> Lines 401-425 must be completed.”
65a Total acquired emission rights [t CO2/yr] “These are credits for indirect GHG savings related alternative fossil fuels, plus emission rights purchased / sold, etc.
=line 417. ”
Net CO2 Emissions (= gross CO2 minus acquired emission rights) 1990 1991 1992 1993 1994 1995 1996 1997 1998 1999 2000
71 Absolute net CO2 [t CO2/yr] “Total direct emissions from raw materials, kiln fuels and non-kiln fuels, minus accquired emission rights;
=line59 – line65a”
73 Specific net CO2 per tonne of clinker produced [kg CO2/t cli] “Net emissions from raw materials, kiln fuels and non-kiln fuels, divided by own clinker production;
=line71 / line8”
74 tonne of cementitious product [kg CO2/t cem prod] Net emissions from raw materials, kiln fuels and non-kiln fuels, divided by own production of cementitious products; =line71 / line21a
77 Improvement rate – net CO2 per tonne of cementitious product [% relative to base yr] Reduction of specific emissions relative to base year (default 1990), =(line74 yr n – line74 yr 1990) / line74 yr 1990 * 100
Specific CO2 from Indirect and Biomass Sources 1990 1991 1992 1993 1994 1995 1996 1997 1998 1999 2000
82a Specific indirect CO2 from power produced externally [t CO2/t cem prod] =line49a / line21a
82b Specific indirect CO2 from net clinker imports (+) / exports (-) [t CO2/t cem prod] =line49c / line21a
83 Specific CO2 from biomass fuels (Memo Item) [t CO2/t cem prod] =line50 / line21a
General Performance Indicators 1990 1991 1992 1993 1994 1995 1996 1997 1998 1999 2000
91 Net clinker sales per net clinker consumption [%] “percentage of direct clinker sales versus clinker consumed to produce cement;
=(line10 – line9) / line11 * 100”
92 Clinker/cement factor in cements [%] “Clinker/cement factor in cements (exclusive clinker sold) = Total clinker consumed divided by the total of cements produced;
=line11 / line21 * 100”
93 Specific heat consumption of clinker production [MJ/t cli] Total heat consumption of kilns divided by the clinker production; =line25 * 10^6 / line8
94 Conventional fossil fuel rate [%] Consumption of conventional fossil fuels divided by the total heat consumption of kilns; =line26 / line25 * 100
95 Alternative fossil fuel rate [%] Consumption of alternative fossil fuels divided by the total heat consumption of kilns; =line27 / line25 * 100
96 Biomass fuel rate [%] Consumption of biomass fuels divided by the total heat consumption of kilns; =line28 / line25 * 100
97 Specific power consumption [kWh/t cement] Total plant power consumption divided by total cements produced; =line33 * 1000 / line21
KILN FUELS – DETAILED INFORMATION
Kiln Fuel Consumption in tonnes per year 1990 1991 1992 1993 1994 1995 1996 1997 1998 1999 2000
101 Conventional fossil fuels
102 coal + anthracite + waste coal [t/yr] This table lists the consumption of conventional fossil fuels in tonnes per year. Some fuel types are clustered for reasons of simplicity, but may be unclustered as appropriate
103 petrol coke [t/yr]
104 (ultra) heavy fuel [t/yr]
105 diesel oil [t/yr]
106 natural gas [1’000 Nm3/yr]
107 shale [t/yr]
107a lignite [t/yr]
108 Alternative fossil fuels
109 waste oil [t/yr] This table lists the consumption of alternative fossil fuels in tonnes per year. Some fuel types are clustered for reasons of simplicity, but may be unclustered as appropriate
110 tyres [t/yr]
111 plastics [t/yr]
112 solvents [t/yr]
113 impregnated saw dust [t/yr]
113a mixed industrial waste [t/yr]
114 other fossil based wastes [t/yr]
115 Biomass fuels
116 dried sewage sludge [t/yr] This table lists the consumption of biomass fuels in tonnes per year. Some fuel types are clustered for reasons of simplicity, but may be unclustered as appropriate
117 wood, non impregnated saw dust [t/yr]
118 paper, carton [t/yr]
119 animal meal [t/yr]
120 animal bone meal [t/yr]
121 animal fat [t/yr]
122 agricultural, organic, diaper waste, charcoal [t/yr]
123 other biomass [t/yr]
Fuel Lower Heating Values 1990 1991 1992 1993 1994 1995 1996 1997 1998 1999 2000
131 Conventional fossil fuels
132 coal + anthracite + waste coal [GJ/t] “Average lower heating value (= net calorific value) of fuels.
Values should refer to the same moisture content as the fuel consumption data listed in lines 101-123 (for example, based on dry weight).”
133 petrol coke [GJ/t]
134 (ultra) heavy fuel [GJ/t]
135 diesel oil [GJ/t]
136 natural gas [GJ/1’000 Nm3]
137 shale [GJ/t]
137a lignite [GJ/t]
138 Alternative fossil fuels
139 waste oil [GJ/t] “Average lower heating value (= net calorific value) of fuels.
Values should refer to the same moisture content as the fuel consumption data listed in lines 101-123 (for example, based on dry weight).”
140 waste tyres [GJ/t]
141 plastics [GJ/t]
142 solvents [GJ/t]
143 impregnated saw dust [GJ/t]
143a mixed industrial waste [GJ/t]
144 other fossil based wastes [GJ/t]
145 Biomass fuels
146 sewage sludge [GJ/t] “Average lower heating value (= net calorific value) of fuels.
Values should refer to the same moisture content as the fuel consumption data listed in lines 101-123 (for example, based on dry weight).”
147 wood, non impregnated saw dust [GJ/t]
148 paper, carton [GJ/t]
149 animal meal [GJ/t]
150 animal bone meal [GJ/t]
151 animal fat [GJ/t]
152 agricultural, organic, diaper waste, charcoal [GJ/t]
153 other biomass [GJ/t]
Kiln Fuel Consumption in terajoules (TJ) per year 1990 1991 1992 1993 1994 1995 1996 1997 1998 1999 2000
161 Conventional fossil fuels [TJ/yr] This is the total consumption of all conventional fossil kiln fuels. This result is registered in line 26 above
162 coal + anthracite + waste coal [TJ/yr] Consumption of conventional fossil kiln fuels, calculated from the amount of each fuel and their lower heating values.
163 petrol coke [TJ/yr]
164 (ultra) heavy fuel [TJ/yr]
165 diesel oil [TJ/yr]
166 natural gas [TJ/yr]
167 shale [TJ/yr]
167a lignite [TJ/yr]
168 Alternative fossil fuels [TJ/yr] This is the total consumption of all alternative fossil kiln fuels. This result is registered in line 27 above
169 waste oil [TJ/yr] Consumption of alternative fossil kiln fuels, calculated from the amount of each fuel and their lower heating values.
170 waste tyres [TJ/yr]
171 plastics [TJ/yr]
172 solvents [TJ/yr]
173 impregnated saw dust [TJ/yr]
173a mixed industrial waste [TJ/yr]
174 other fossil based wastes [TJ/yr]
175 Biomass fuels [TJ/yr] This is the total consumption of all biomass kiln fuels. This result is registered in line 28 above
176 sewage sludge [TJ/yr] Consumption of biomass kiln fuels, calculated from the amount of each fuel and their lower heating values.
177 wood, non impregnated saw dust [TJ/yr]
178 paper, carton [TJ/yr]
179 animal meal [TJ/yr]
180 animal bone meal [TJ/yr]
181 animal fat [TJ/yr]
182 agricultural, organic, diaper waste, charcoal [TJ/yr]
183 other biomass [TJ/yr]
CO2 Emission Factors of Kiln Fuels (per lower heating value) 1990 1991 1992 1993 1994 1995 1996 1997 1998 1999 2000
185 Conventional fossil fuels
186 coal + anthracite + waste coal [kg CO2/GJ] “CO2 emission factors of fuels, expressed in kg CO2 per GJ lower heating value.
Default emission factors are taken from Worksheet “”Fuel CO2 Factors””.
Enter plant- or company-specific emission factors if available
To hide lines 185-209, click grey “”-“”-button located left of line 209 (separately for Plant and Company worksheets).”
187 petrol coke [kg CO2/GJ]
188 (ultra) heavy fuel [kg CO2/GJ]
189 diesel oil [kg CO2/GJ]
190 natural gas [kg CO2/GJ]
191 shale [kg CO2/GJ]
192 lignite [kg CO2/GJ]
193 Alternative fossil fuels
194 waste oil [kg CO2/GJ] “CO2 emission factors of fuels, expressed in kg CO2 per GJ lower heating value.
Default emission factors are taken from Worksheet “”Fuel CO2 Factors””.
Enter plant- or company-specific emission factors if available.”
195 waste tyres [kg CO2/GJ]
196 plastics [kg CO2/GJ]
197 solvents [kg CO2/GJ]
198 impregnated saw dust [kg CO2/GJ]
199 mixed industrial waste [kg CO2/GJ]
200 other fossil based wastes [kg CO2/GJ]
201 Biomass fuels
202 sewage sludge [kg CO2/GJ] “CO2 emission factors of fuels, expressed in kg CO2 per GJ lower heating value.
Default emission factors are taken from Worksheet “”Fuel CO2 Factors””.
Enter plant- or company-specific emission factors if available.”
203 wood, non impregnated saw dust [kg CO2/GJ]
204 paper, carton [kg CO2/GJ]
205 animal meal [kg CO2/GJ]
206 animal bone meal [kg CO2/GJ]
207 animal fat [kg CO2/GJ]
208 agricultural, organic, diaper waste, charcoal [kg CO2/GJ]
209 other biomass [kg CO2/GJ]
CO2 Emissions from Kiln Fuels 1990 1991 1992 1993 1994 1995 1996 1997 1998 1999 2000
211 Conventional fossil fuels – total emissions [t CO2/yr] These are the total CO2 emissions from all conventional fossil kiln fuels. This result is registered in line 40 above
212 coal + anthracite + waste coal [t CO2/yr] This table calculates CO2 emissions by multiplying the energy consumption (in TJ/year, lines 161 ff) with the appropriate emission factors (given in lines 185ff)
213 petrol coke [t CO2/yr]
214 (ultra) heavy fuel [t CO2/yr]
215 diesel oil [t CO2/yr]
216 natural gas [t CO2/yr]
217 shale [t CO2/yr]
217a lignite [t CO2/yr]
218 Alternative fossil fuels – total emissions [t CO2/yr] These are the total CO2 emissions from all alternative fossil kiln fuels. This result is registered in line 41 above
219 waste oil [t CO2/yr] This table calculates CO2 emissions by multiplying the energy consumption (in TJ/year, lines 168 ff) with the appropriate emission factors (given in lines 192ff)
220 waste tyres [t CO2/yr]
221 plastics [t CO2/yr]
222 solvents [t CO2/yr]
223 impregnated saw dust [t CO2/yr]
223a mixed industrial waste [t CO2/yr]
224 other fossil based wastes [t CO2/yr]
225 Biomass fuels – total emissions [t CO2/yr] These are the total CO2 emissions from all biomass kiln fuels. This result is registered in line 50 above
226 sewage sludge [t CO2/yr] This table calculates CO2 emissions by multiplying the energy consumption (in TJ/year, lines 175 ff) with the appropriate emission factors (given in lines 200ff)
227 wood, non impregnated saw dust [t CO2/yr]
228 paper, carton [t CO2/yr]
229 animal meal [t CO2/yr]
230 animal bone meal [t CO2/yr]
231 animal fat [t CO2/yr]
232 agricultural, organic, diaper waste, charcoal [t CO2/yr]
233 other biomass [t CO2/yr]
NON-KILN FUELS – DETAILED INFORMATION
Non-Kiln Fuel Consumption in tonnes per year 1990 1991 1992 1993 1994 1995 1996 1997 1998 1999 2000
301 Equipment and On-Site Vehicles
301a diesel oil [t/yr] This table lists the consumption of fuels used by equipment and on-site vehicles in tonnes per year. Some fuel types are clustered for reasons of simplicity, but may be unclustered as appropriate
301b gasoline [t/yr]
302 Room Heating and Cooling
302a diesel oil [t/yr] This table lists the consumption of fuels used for room heating and cooling in tonnes per year. Some fuel types are clustered for reasons of simplicity, but may be unclustered as appropriate
302b natural gas [1’000 Nm3/yr]
303 Drying of raw materials and mineral components
303a coal + anthracite + waste coal [t/yr] “This table lists the consumption of fuels used for drying of raw materials and mineral components in tonnes per year.
Some fuel types are clustered for reasons of simplicity, but may be unclustered as appropriate”
303b petrol coke [t/yr]
303c (ultra) heavy fuel [t/yr]
303d diesel oil [t/yr]
303e natural gas [1’000 Nm3/yr]
303f shale [t/yr]
304 On-site power generation
304a coal + anthracite + waste coal [t/yr] This table lists the consumption of fuels used on-site power generation in tonnes per year. Some fuel types are clustered for reasons of simplicity, but may be unclustered as appropriate
304b (ultra) heavy fuel [t/yr]
304c diesel oil [t/yr]
304d natural gas [1’000 Nm3/yr]
304e biomass fuels [t/yr]
Non-Kiln Fuel Lower Heating Values and CO2 Emission Factors 1990 1991 1992 1993 1994 1995 1996 1997 1998 1999 2000
310 kg CO2/GJ fuel name
311 Equipment and On-Site Vehicles
311a diesel oil [GJ/t] “Average lower heating values (= net calorific value) and CO2 emission factors of fuels.
Where no emission factor is indicated, the factor of the corresponding kiln fuel (line 185ff) is used.”
311b 69.2 gasoline [GJ/t]
312 Room Heating and Cooling
312a diesel oil [GJ/t] “Average lower heating values (= net calorific value) and CO2 emission factors of fuels.
Where no emission factor is indicated, the factor of the corresponding kiln fuel (line 185ff) is used.”
312b natural gas [GJ/1’000 Nm3]
313 Drying of raw materials and mineral components
313a coal + anthracite + waste coal [GJ/t] “Average lower heating values (= net calorific value) and CO2 emission factors of fuels.
Where no emission factor is indicated, the factor of the corresponding kiln fuel (line 185ff) is used.”
313b petrol coke [GJ/t]
313c (ultra) heavy fuel [GJ/t]
313d diesel oil [GJ/t]
313e natural gas [GJ/1’000 Nm3]
313f shale [GJ/t]
314 On-site power generation
314a coal + anthracite + waste coal [GJ/t] “Average lower heating values (= net calorific value) and CO2 emission factors of fuels.
Where no emission factor is indicated, the factor of the corresponding kiln fuel (line 185ff) is used.”
314b (ultra) heavy fuel [GJ/t]
314c diesel oil [GJ/t]
314d natural gas [GJ/1’000 Nm3]
314e biomass fuels [GJ/t]
Non-Kiln Fuel Consumption in terajoules (TJ) per year 1990 1991 1992 1993 1994 1995 1996 1997 1998 1999 2000
321 Equipment and On-Site Vehicles [TJ/yr] This is the sum of equipment and on-site vehicles. The result is registered in line 30 above
321a diesel oil [TJ/yr] Energy consumption calculated from non-kiln fuel consumption and lower heating values
321b gasoline [TJ/yr]
322 Room Heating and Cooling [TJ/yr] This is the sum of room heating and cooling. The result is registered in line 31a above
322a diesel oil [TJ/yr] Energy consumption calculated from non-kiln fuel consumption and lower heating values
322b natural gas [TJ/yr]
323 Drying of raw materials and mineral components [TJ/yr] This is the sum of drying of raw materials and mineral components. The result is registered in line 31b above
323a coal + anthracite + waste coal [TJ/yr] Energy consumption calculated from non-kiln fuel consumption and lower heating values
323b petrol coke [TJ/yr]
323c (ultra) heavy fuel [TJ/yr]
323d diesel oil [TJ/yr]
323e natural gas [TJ/yr]
323f shale [TJ/yr]
324 On-site power generation [TJ/yr] This is the sum of on-site power generation. The result is registered in line 31c above
324a coal + anthracite + waste coal [TJ/yr] Energy consumption calculated from non-kiln fuel consumption and lower heating values
324b (ultra) heavy fuel [TJ/yr]
324c diesel oil [TJ/yr]
324d natural gas [TJ/yr]
324e biomass fuels [TJ/yr]
CO2 Emissions from Non-Kiln fuels 1990 1991 1992 1993 1994 1995 1996 1997 1998 1999 2000
331 Equipment and On-Site Vehicles [t CO2/yr] This is the sum of equipment and on-site vehicles. The result is registered in line 44 above
331a diesel oil [t CO2/yr] This table calculates CO2 emissions by multiplying the energy consumption (in TJ/year, lines 321 ff) with the appropriate emission factors (lines 185ff, except for gasoline where the emission factor is taken from line is 311b).
331b gasoline [t CO2/yr]
332 Room Heating and Cooling [t CO2/yr] This is the sum of room heating and cooling. The result is registered in line 45a above
332a diesel oil [t CO2/yr] This table calculates CO2 emissions by multiplying the energy consumption (in TJ/year, lines 322 ff) with the appropriate emission factors (lines 185ff).
332b natural gas [t CO2/yr]
333 Drying of raw materials and mineral components [t CO2/yr] This is the sum of drying of raw materials and mineral components. The result is registered in line 45b above
333a coal + anthracite + waste coal [t CO2/yr] This table calculates CO2 emissions by multiplying the energy consumption (in TJ/year, lines 323 ff) with the appropriate emission factors (lines 185ff)
333b petrol coke [t CO2/yr]
333c (ultra) heavy fuel [t CO2/yr]
333d diesel oil [t CO2/yr]
333e natural gas [t CO2/yr]
333f shale [t CO2/yr]
334 On-site power generation (excl. biomass fuels) [t CO2/yr] This is the sum of on-site power generation (excluding CO2 from biomass fuels). The result is registered in line 45c above
334a coal + anthracite + waste coal [t CO2/yr] “This table calculates CO2 emissions by multiplying the energy consumption (in TJ/year, lines 324 ff) with the appropriate emission factors (lines 185ff).
CO2 from biomass fuels is registered as a memo item in line 50 above”
334b (ultra) heavy fuel [t CO2/yr]
334c diesel oil [t CO2/yr]
334d natural gas [t CO2/yr]
334e biomass fuels (memo item) [t CO2/yr]
CO2 EMISSION RIGHTS OBTAINED
Description of CO2 Reporting and Compliance Scheme 1990 1991 1992 1993 1994 1995 1996 1997 1998 1999 2000
401 Name of scheme Name of CO2 reporting and compliance scheme, for example: EU ETS, or Corporate Voluntary Target. Completion of Lines 401-416 is mandatory if you wish to calculate your Net Emissions.
402 Type of scheme Choose either voluntary, or mandatory / negotiated
403 Credits for alternative fossil fuels under this scheme % Indicate to what extent the direct CO2 from alternative fossil fuels is eligible for a credit for indirect emission reductions. 0% = no credit; 100% = credit equivalent to full direct CO2 emissions. 100% makes alternative fossil fuels effectively climate-neutral.
404 Other comments
Initial Emission Rights 1990 1991 1992 1993 1994 1995 1996 1997 1998 1999 2000
410 Specific emissions target (if applicable) [kg CO2/t cem prod] Indicate the specific emissions target, if applicable
411 Gratis emission rights [t CO2e/yr] These are all emission rights that are obtained from the regulator for free, whether tradeable or not, including those defined implicitly by voluntary emissions targets (e.g., specific target x production in current year)
412 Emission rights procured from regulator [t CO2e/yr] These are all emission rights obtained from the regulator against payment
413 Total initial emission rights [t CO2e/yr] =line411 + line412
Acquired Emission Rights 1990 1991 1992 1993 1994 1995 1996 1997 1998 1999 2000
414 Emission rights purchased (+), sold (-) [t CO2e/yr] These are all emission rights that are purchased in a market, but not those purchased from the regulator during initial allocation
415 Credits for indirect savings through alternative fossil fuels [t CO2e/yr] =line41 * line403
416 Other credits (please specify) [t CO2e/yr] Emission rights obtained from other sources, e.g. as a reward for for waste heat exported to external consumers
417 Total acquired emission rights [t CO2e/yr] =SUM (line414:line416). This result is registered in line 65a above.
Total Emission Rights Obtained 1990 1991 1992 1993 1994 1995 1996 1997 1998 1999 2000
418 Sum of initial and acquired emission rights [t CO2e/yr] =line413 + line417
CO2 COMPLIANCE AND ACCOUNTING
Emission Rights Held 1990 1991 1992 1993 1994 1995 1996 1997 1998 1999 2000
420 Emission rights obtained [t CO2e/yr] =line418
421 Emission rights carried over (banked) from previous year [t CO2e/yr] =line426
422 Total emission rights held [t CO2e/yr] =line420 + line421
CO2 Compliance 1990 1991 1992 1993 1994 1995 1996 1997 1998 1999 2000
423 Emissions subject to compliance (Default = Gross CO2) [t CO2/yr] Enter the emissions that are covered by the CO2 compliance scheme (default = gross CO2 emissions in line59)
424 Balance of emission rights held and subject emissions (+ = long; – = short) [t CO2e/yr] =line422 – line423; positive balance = excess emission rights (long position); negative balance = excess emissions (short pos.)
Banking 1990 1991 1992 1993 1994 1995 1996 1997 1998 1999 2000
425 Bankability of balance (= ability to carry over position to next year) [%] Indicate whether short / long position can be carried over to next year (100% = full bankability; 0% = no bankability). For example, 100% bankability means that excess emission rights held in a given year can be fully used for compliance in the next year.
426 Emission rights carried over to next year (+ = long; – = short) [t CO2e/yr] =line424 * line425