Contents
Everything you need to know about On-Line Quality Control Instrumentation in Cement Manufacturing Process
[wpecpp name=”package” price=”75″ align=”center”]
Traditional instrumentation and control at a cement manufacturing plant has been carried out by taking samples from different processing points and analyzing them in a central laboratory, either manually, or in some cases automatically. This approach is now being challenged in modern cement plants, by the installation of ‘on-line measurement systems’ that present a number of advantages over the traditional methods – notably in terms of higher frequency and more timely controls, resulting in energy savings and better and more stable product quality. New instrumenta-tion is now available in the market that provides an effective way of controlling the complete cement manufacturing process. These instruments also have the advantage of being cheaper and simpler to operate than central automatic laboratories.
This chapter provides a brief description of each of the control instruments, their installation, effectiveness in the process control, and cost justifications. The four major areas covered in the chapter are – raw mix control, precalciner control, clinker control, and cement control.
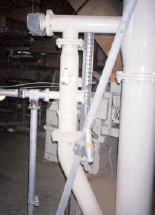
Figure 5.2.1. Raw mix sampling system for on line analysis attached to chute leading to mix transport system.
RAW MIX CONTROL
A stable raw mix with the right concentration of each of the four major oxides (CaO, SiO2,Al2O3, and Fe2O3) is essential for the stability of the kiln operation and the quality of the finished product. Fluctuations in the composition result in a harder to burn raw mix requiring higher energy consumption. The clinker produced is often of poor quality with lower strengths that needs to be ground finer to achieve the required strengths – leading to even more energy consumption.
Traditionally, a raw mix sample is brought back to the laboratory to be analyzed every 1 to 2 hours, and the results of the analysis are used to correct the component mix. However, with the online instrumentation the analysis is carried out on site every 5 minutes, and the corrections to the mix can be done automatically.
It is advantageous that the analyzer be installed after the raw mill. One of the main benefits of an analyzer after the raw mill is that it analyzes the whole composite that will be going into the blend-ing silo, including, where possible, all the fines returning from the dust collection system. These fines can vary considerably in quality as well as quantity, and typically can have a chemical compo-sition significantly different from that of the intended raw mix. Therefore, unlike with a ‘before the mill control’ installation, it would be possible to adjust the weigh feeders on the additives depend-ing on the nature of the fine dust return.
Components of the System
Sampling system. The raw mix sample is collected in a chute after the separator using a screw sampler (Figure 5.2.1). A volumetric sampler grabs the material to be analyzed at the discharge of this sampler, and the sampled material drops by gravity into the analyzer. The excess material is returned into the material flow. The whole system is airtight and is not affected by pressure fluctuations in the chute.
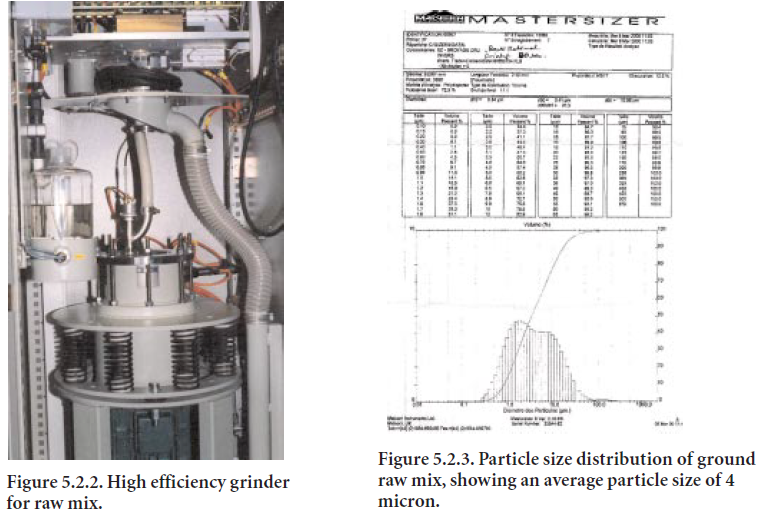
Raw mix analyzer. A 25-gram sample of raw mix is ground using a high-efficiency grinder (Figure 5.2.2). The average particle size of the ground powder is less than 4 microns (Figure 5.2.3), ensuring an accurate analysis. An accurate material analysis is essential to design a raw mix that is able to produce a clinker (and cement) of intended chemical composition and physical characteristics.
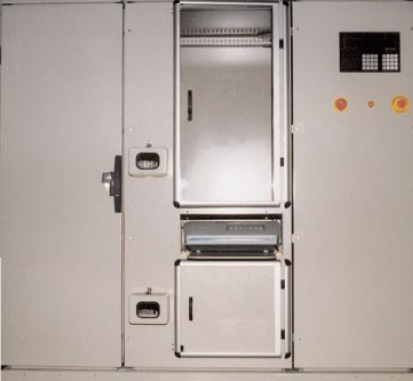
Figure 5.2.4. An automated on-line raw mix analyzer.
The prepared sample is then analyzed using an automatic on-line analyzer (Figure 5.2.4) and the results of the major oxides composition (SiO2,Al2O3,Fe2O3, and CaO) are outputted to the plant control system. The results are then used to adjust the weigh feeders on the materials as well as on the additives.
Table 5.2.1. Data on Raw Mix Analysis from a Commercial Cement Plant
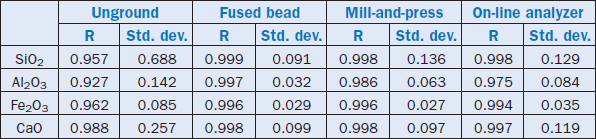
Comparative testing. Selected data on raw mix analysis from a commercial cement plant are shown in Table 5.2.1. These are regression results obtained for 20 different raw mix samples from one plant in Italy. The data shows a comparison of on-line analysis with the commonly used analytical techniques such as the unground, fused bead, and mill-and-press techniques.
The data suggests that the material source (quarry) has the characteristic of having a large percent-age of quartz (silica, SiO2) in the raw mix. This explains why the analysis of the unground samples has such a high standard deviation for the silica.
Raw mix analysis obtained with the on-line analyzer using the high efficiency grinding is consis-tent and easily comparable to that obtained with the other methods; in fact, the standard deviation on SiO2 is even lower than with a traditional automatic mill-and-press method. The fused bead method achieves better results.
It can therefore be inferred that in cases where there are hard-to-analyze composites (such as those containing quartz or fly ash), the quality of the analysis using an on-line system is as good or better than a traditional automatic mill-and-press method at the plant laboratory. It can also be said that directly analyzing coarsely ground (non-fine) materials, using an XRF analyzer, is not a viable option to correctly control the raw mix, because the error is far too great.
PRECALCINER CONTROL
Knowledge of the degree of calcination of raw feed at the kiln inlet is essential in controlling the firing conditions in the precalciner, subsequently optimizing the fuel consumption in the precal-ciner as well as in the kiln. A more completely calcined kiln feed requires less thermal input in the kiln, and leads to improved production. Traditionally a grab sample is collected manually at considerable risk to the operator, and brought back to the laboratory to be analyzed every 8 to 24 hours. However, with the on-line instrument, the analysis is carried out on site every 30 minutes.
Components of the System
Figure 5.2.5 illustrates major components of the on-line sampler and analyzer of samples from the precalciner. The sample is collected from the calciner chute leading to the rotary kiln.
The sampler. The sampler is located at the precalciner discharge end of the kiln inlet chute (Figure 5.2.6). The air-cooling quenching mechanism is mounted immediately below the sample discharge, from where the sample, after quenching, is conveyed to the analyzer.
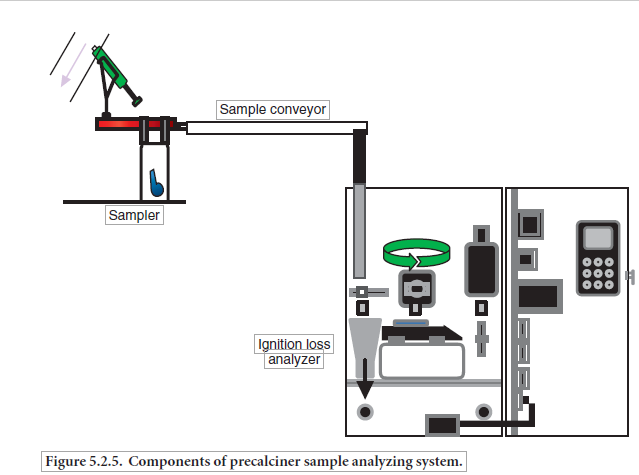
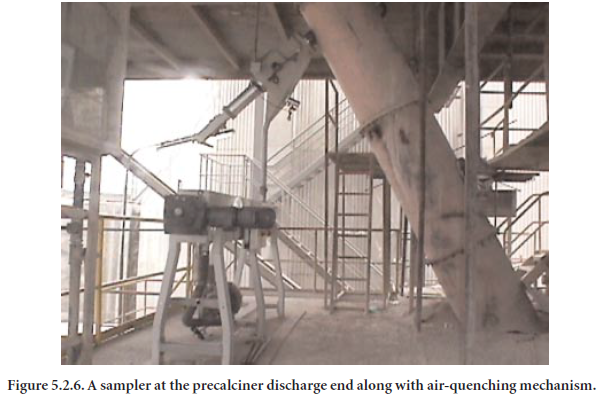
The sample is collected automatically from the kiln inlet chute. The material is air cooled to freeze the calcination reaction and is then conveyed to the analyzer located near the sampling point. The cooling air never comes in contact with the sampled material. Samples are typically analyzed for ignition loss at 975°C to determine the degree of calcination.
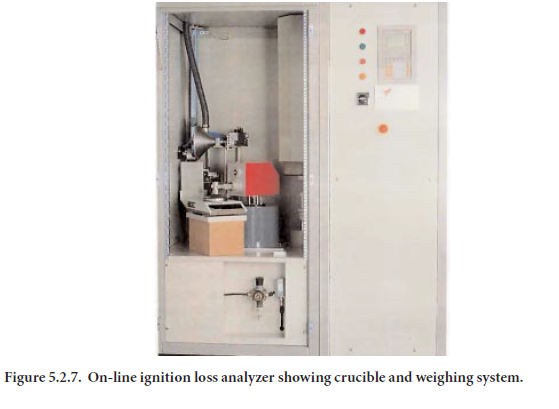
Ignition loss analyzer. In order to determine the degree of calcination of raw mix from the precalciner to kiln inlet, the loss of ignition at 975°C is determined automatically at regular inter-vals. The sample is introduced into a special stainless steel alloy crucible; it is weighed, heated to 975°C for 25 minutes, and weighed again (Figure 5.2.7). The loss in weight gives the degree of calcination of the material, as follows:
Calination, % = [wt. loss of material from calciner/wt. loss of actual raw feed] x 100
Based on the calcination data, an adjustment in fuel supply to the precalciner can be made to enhance its thermal profile to optimize efficiency.
CLINKER CONTROL
The principal product collected from the rotary kiln is clinker, that is later interground with gypsum to produce portland cement. It is critical that the phase composition of the clinker is correct in order to produce cement of acceptable chemical and physical properties. Although the composition of the clinker is directly related to the composition of the raw mix, it is the pyropro-cessing of the raw mix in the kiln that plays a similarly critical role in achieving the targeted clinker phases. Generally, for instance, an underburned clinker from even a correctly prepared raw material can have high free lime and low alite phase. The percentage of free lime in clinker decreases as the burning zone temperature in the kiln is increased. A high free lime content in cement can cause concrete to expand, resulting in cracks and flakes in the concrete structure. Therefore, determina-tion of free lime is an essential element to characterize the quality of portland cement.
Free Lime Analysis
Traditionally, to avoid excessive free lime, kiln operators are instructed to operate the kiln so as to have an average free lime value significantly lower than the specified level. The free lime is deter-mined by a laboratory technician, on a frequency of once an hour to once a shift. The clinker sample in such cases is taken manually on the pan conveyor after the cooler discharge and analyzed in the laboratory using a titration method after glycol or glycerol extraction.
With the on-line instrument the analysis is carried out on site every 10 minutes, and the correc-tions to the firing conditions in the kiln can be done automatically. It is therefore possible to oper-ate the kiln in the optimum range of free lime, saving costs on the burning process as well as on the grinding process, as hard burnt clinker is also harder to grind and may produce cement with disappointing early strength.
Components of the System
The basic components of the on-line free lime analyzer are shown in Figure 5.2.8. The clinker sample is collected and transported to the analyzer located near the sampling point, where the sample is ground and analyzed for free lime content.
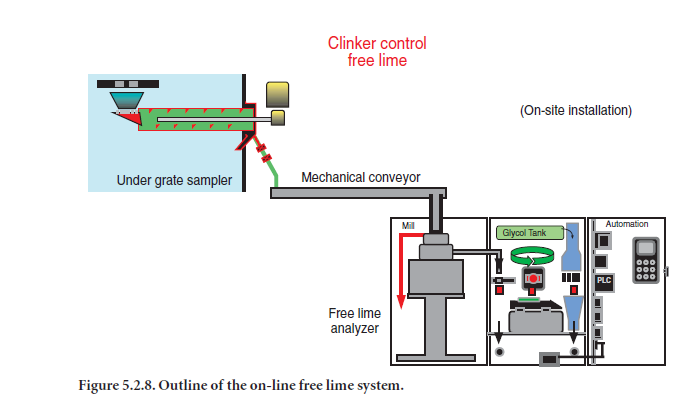
The clinker samples can be collected from various locations in the clinker cooler as follows:
• At the kiln outlet before the cooler
• Underneath the grate plates in the second or third chamber of the cooler
• After the crusher at the cooler outlet
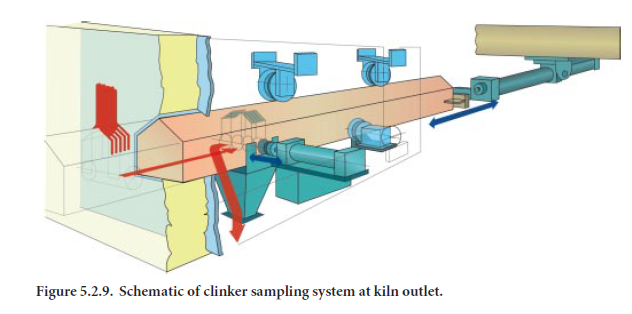
Sampling at the kiln outlet. The sampling system is installed in the throat of the cooler next to the rotary kiln outlet as schematically shown in Figure 5.2.9.
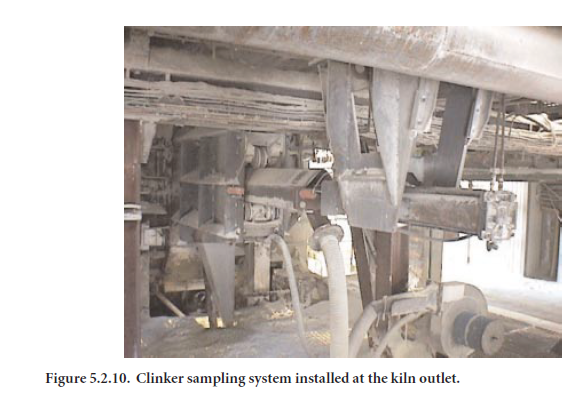
An actual clinker sampler installed at the kiln outlet is shown in Figure 5.2.10, where the clinker sample is collected directly as it is falling from the rotary kiln.
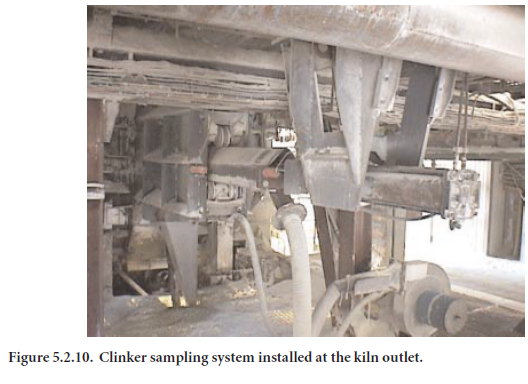
Clinker is collected at the fall of the kiln using an air-cooled refractory steel beam. The beam is pushed into the material stream using a pneumatic actuator. About 300 grams of material is collected. The beam is retracted, and the sample is removed from inside the beam.
Sampling under the grate plates. This sampling system is installed in the second or third chamber of the grate cooler depending on the clinker temperature – maximum allowable tempera-ture is generally 500°C. A schematic of this system is shown in Figure 5.2.11, whereas an installed sampler at a cement plant is shown in Figure 5.2.12.
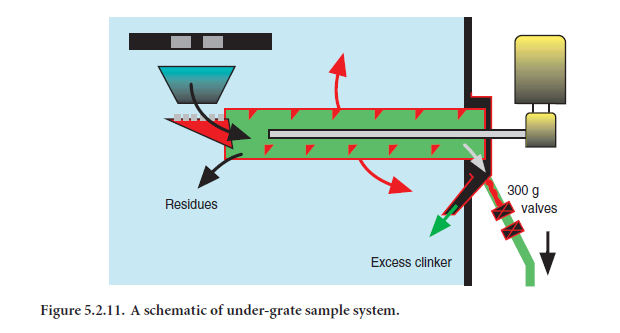
The clinker continuously falls through 2 to 4 fixed grate plates in which 30- to 50-mm holes have been drilled. When a sample is required, the screw sampler is operated and about 300 g of material is extracted from the side of the cooler. Excess clinker falls into the under grate drag chain.
Sample transport equipment. The 300 g sample is transported to the analyzer that is generally located in close proximity to the cooler in an air conditioned location, using a mechanical trans-port system such as single bucket on a chain conveyer. In case the analyzer is located at greater distances (30 m to 150 m), a bulk pneumatic transport system is used.
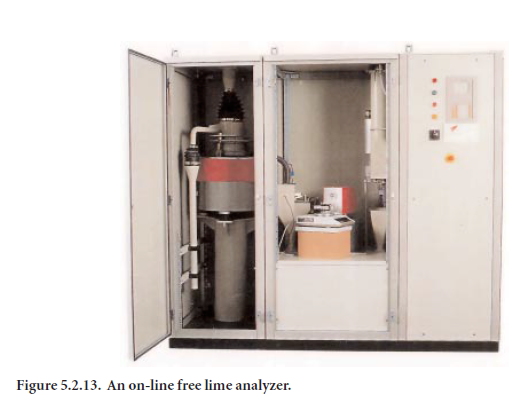
The free lime analyzer. Clinker is ground to fineness of about 2000 cm2/g Blaine using a disk mill. The ground clinker and the glycol are weighed using an electronic scale and then fed into a reaction beaker. The solution is heated and stirred. Once the free lime is dissolved, the electrocon-ductivity of the solution is measured and the data is converted into a free lime value, shown on the front display panel, and sent electronically to the central control room. The free lime analyzer unit is shown in Figure 5.2.13.
The analyzer includes a sample preparation cell, an analysis cell, and a cell that controls automa-tion of the system such as sampling, sample transport, and analyzer.
Kiln Control Strategies Using On-Line Free Lime Analyzer
On-line measurement and kiln operation data. The graph in Figure 5.2.14 shows the data obtained at a plant in Japan a few months after having installed a free lime analyzer system. The data show a correlation between free lime values and kiln operation data that was measured by changing the coal consumption (energy) intentionally while the kiln was operating in a stable condition.
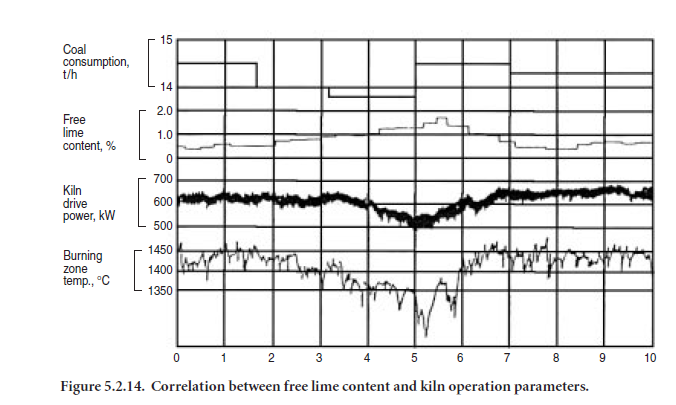
It can be seen that as the coal supply is decreased, the free lime values increase and the burning zone temperature decreases; and as the coal supply is increased, the free lime values decrease and the burning zone temperature increases.
The following facts emerge from this data:
• A change in fuel feed results in a noticeable change in free lime prior to a change in kiln amps, and about the same time as a change in burning zone temperature.
• Burning zone temperature is an unstable measurement for higher values of free lime, as the kiln tends to be dustier, and therefore the clinkering zone more difficult to see.
• The kiln amps show significant signs of change only for large fluctuations in free lime.
• Kiln amps are not a stable indicator of the burning zone conditions. It can be seen on the graph that the kiln amps for the second half of the graph are higher than in the first part, for a free lime value that is about the same.
• Free lime peaks can last less than 1 hour on precalciner kilns, as can be seen between hours 5 and 6.
It must be realized that free lime as measured by the on-line analyzer is an absolute number that is not dependent on factors that may otherwise affect the other control parameters normally used for kiln control purposes. For instance:
• Kiln amps, the most widely used parameter for kiln control, is typically affected by buildup in the kiln, and is a very slow indicator to a change in free lime content.
• Burning zone temperature measurement may be influenced by a change of concentration of dust or a buildup between the pyrometer and the clinkering zone being measured.
• NO can be influenced by several factors including quality of the fuel, or the accuracy of the gas sampling system at the back end of the kiln.
Possible kiln control strategies. Based on the facts outlined above, some of the strategies currently being employed at cement plants use the following logic:
• Incremental instantaneous control is based on either NOx, BZT, or kiln amps, or a weighted combination of these factors, around given set points.
• Free lime is measured automatically at a high frequency (typically every 10 to 20 min to see the trends building). The clinker is sampled as close as possible to the clinkering zone to reduce the lag time between the free lime result and the kiln operational data. The free lime result is then used to update/correct the set points for each of the factors.
A case study. Based on the discussion and observation above, a case study on the correlation of free and the optimizing of kiln operation of a commercial plant is cited here.
The graph in Figure 5.2.15 shows the average monthly values of free lime on two wet processing rotary kilns.
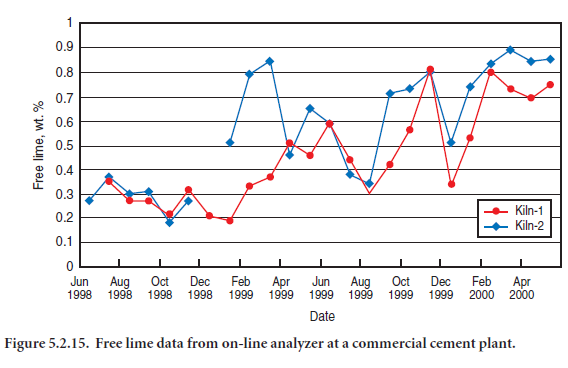
From June 1998 to January 1999, the free lime data were collected but not used to control the kiln. From January 1999 to December 1999, the kiln expert control system was shut down for modifica-tion, and the kiln operator, using the free lime data as the main control factor, controlled the kiln manually. It can be seen that the average free lime values were higher, but with some variances.
From January 2000 onward, the kiln expert control system was reconnected using free lime as the main control factor. The kiln then ran at stable values around 0.5% to 0.6% higher than they were at the start of the project.
This resulted in fuel savings of about 15 Kcal/kg clinker, as well as savings in grinding energy of about 1 kWh/ton of clinker, as the clinker was not overburned and hence easier to grind. The high frequency control also had the advantage of producing better clinker, as it was possible to catch and deal with off specification clinker faster.
Given the savings and the 2 million ton per annum capacity of the plant, the system paid for itself in much less then a year.
CEMENT CONTROL
While producing portland cement at a commercial plant, the main parameters normally evaluated to determine both the physical and chemical qualities of cement are:
• Gypsum additions – by measuring the SO3 content of the finished cement.
• Limestone addition – by measuring the carbon content in the finished cement
• Blaine analysis – a traditional method that uses air permeability to characterize the fineness of the cement.
• Particle size distribution (PSD) analysis – a newer technology that gives a complete grain size distribution of the finished cement and has now replaced Blaine measurement as the de facto control method in modern plants.
Traditionally a cement sample is brought back to the laboratory to be analyzed every 1 to 2 hours, and the results of the analysis are used to correct the process, if needed.
Cement Additions Control
It is essential to control gypsum additions as this has a direct impact on the setting time of the finished cement. With the same instrument it is also possible to determine the limestone additions. The close monitoring of limestone additions can lead to substantial savings as it is possible to replace expensive clinker with cheap limestone without exceeding the maximum regulatory limits.
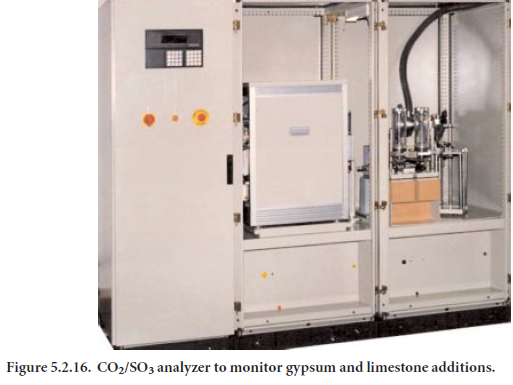
CO2/SO3 analyzer (gypsum/limestone monitoring). A cement sample is dosed into a ceramic crucible of a CO2/SO3 analyzer (Figure 5.2.16). The cement sample is weighed. Tungsten and iron are added to the crucible. The crucible is then introduced into an inductive furnace, and the cement sample is heated up to 1400°C under a constant flow of oxygen. The carbon and sulfur present in the cement combine with the oxygen to form CO2 and SO3. These gases are then meas-ured using infrared detectors. Knowing the concentration of CO2 and SO3 as well as the mass of the cement sample it is possible to determine the carbon and sulfur present in the cement, and therefore the gypsum and limestone content.
Fineness Control
Using an on-line PSD analyzer giving a real time continuous measurement, it is possible to dynam-ically control the speed of the separators at the finish grinding mill and therefore optimize the fineness, saving on the cost of the energy required for grinding.
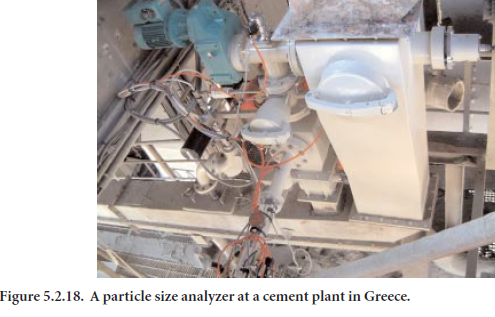
The particle size analyzer. Figure 5.2.17 shows the photograph is of the optical head and real-time sampling interface of the EPCS system. Particles pass through an air purged flow cell, which supports a fixed alignment laser transmitter and solid-state detector based on the classical ensemble laser diffraction technique. As particles pass through the laser beam, light scattered in the forward direction is collected by the receiver lens and focused onto a log-scaled annular ring detec-tor. The detector is scanned at high speed, recorded, and digitized for continuous real-time analysis. An actual particle size analyzer installed at a plant in Greece is shown in Figure 5.2.18.
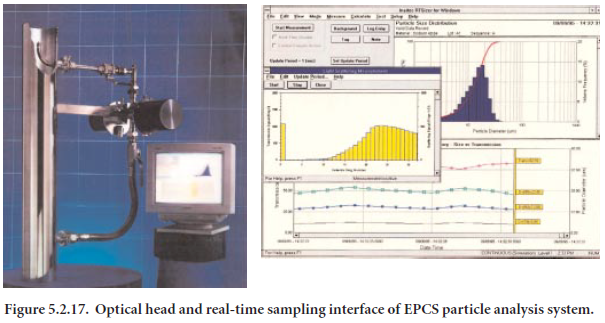
The cement sample is collected using a screw sampler in a chute at the discharge of the separator. A bypass/dilution system is used to extract a portion of the flow, pass it through the instrument, and then back into the primary flow line. This system incorporates a near isoinetic tap that is driven by a venturi eductor.
A Case Study
At a cement plant in Utah, the analyzer is used to measure the size of the finished product. The instrument location is at the product outlet of the milling circuit in a position which allows easy access, facilitating both installation and routine maintenance. As both separator feed and separator rejects are located directly above the instrument, the analyzer may in the future be used for circulating load determination. For instrument-PC communication, a 25-mm. conduit cable run of 120 meters was installed from the instrument to the control building. Since the instrument was put in service in November 1998, it has been trouble free with a 100% run time. Considerable data was reviewed before complete acceptance by production. In June 1999, it was put in an automatic PID loop to control the cement fineness by adjusting the separator speed.
Off-line QC. Before moving to on-line laser diffraction sizing, the plant would measure 5 g of cement every 4 hours in an air-permeability apparatus to estimate a Blaine number. Although the personnel try to be as precise as possible, inherent errors do occur in manual measurements, including:
• losing some of the sample when transferring the cement from the scale to the permeability cell
• failure to compress the sample sufficiently
• using two papers instead of one
• temperature fluctuations
• humidity
• losing manometer fluid
Additionally, due to shift working, Blaine measurements can be carried out by any 1 of 20 people. As an example, if a given plant were to produce cement with a desired Blaine of 3700 cm2/g, the single operator precision as stated in ASTM C 204 is 3.4% for two identical samples, i.e., ±126 cm2/g. However, one cement plant has found that if two different laboratories measure the same sample, the difference could be as much as 6.0% (±222 cm2/g). This is the scenario faced at every shift change, where Blaine measurement variation is inherent in each personnel change. Consequently, more often than not, the separator speed was changed unnecessarily. In an attempt to minimize the effect of measurement variation, separator set points were only changed if the sample varied by more than 100 cm2/g. As the separator speed is held constant between measure-ments, the cement’s actual Blaine value can drift significantly.
Finish Mill Process Control
The analyzer has been used for feedback control for the separator at this plant since the middle of June 1999. The separator speed has been controlled using the “% passing 30 micron” parameter, which provides the best correlation with the traditional plant control parameter of determining the “% passing 325 mesh (45 µm)” by the wet sieve method. Despite the relatively small data set available at that time, the standard deviation (RMS) on fineness decreased by 34% from 1.5% to 1% of the indicated measurement.
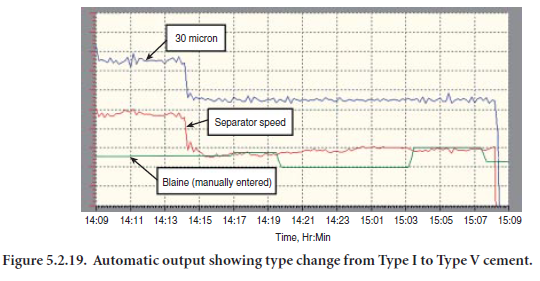
The graph in Figure 5.2.19 shows a change from Type I to Type V cement based on the drop in Blaine fineness. The separator is under automatic control from the PID loop and can be seen to move to the lower speed quickly on June 14 at 14:20 hours. Even though two different % < 30µm set points are used, it is seen that the cement Blaine fineness is nearly the same. The Type V cement, having a higher C2S, is harder to grind.
The use of on-line analysis has resulted in changes to accepted practice. An example of this occurred while milling clinker sourced from external storage. “Outside” clinker is treated with respect as it has already commenced the hydration process and consequently has a high ignition loss. Past practice of the control operator was to slow the separator as the manually measured Blaine value increased. The on-line analyzer output over a similar period (Figure 5.2.20) clearly shows that the separator speed should remain unchanged, as the actual particle size variation is minimal.
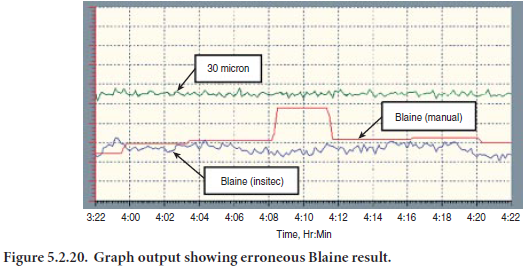
It can be seen that even though mill conditions are steady, the manual Blaine gave an erroneous result. If the operator were still in control, an adjustment to separator speed would have been in order at that point.
Another graph (Figure 5.2.21) shows the difference in mill throughput with a Type V to Type I change that was affected on June 14 at 1500 hours.
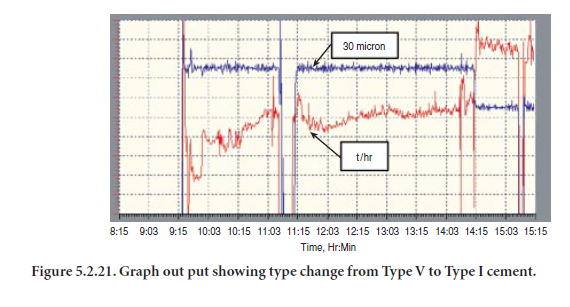
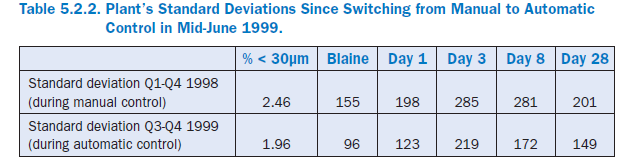
Table 5.2.2 present data of a QC report that gives an indication of how consistently the plant met its target for the year since installing the automatic controls for particle analyses. This chart shows the significant improvement in the plant’s standard deviations since switching from manual to automatic control in mid-June 1999.
CONCLUSIONS
Over the last 20 years, developments in the technology of cement manufacturing have provided a quantum leap for hardware and software tools in both the area of the control room and the labora-tory.Today a new concept has been realized for the entire cement manufacturing process, which provides more stable control, improves product quality, and reduces energy costs.
This concept is actually a hybrid system utilizing the latest developments for process control and the laboratory. This new distributed architecture brings “on-line analysis and control” right out into the four main control areas of the cement manufacturing line: raw meal control, hot meal control, clinker control, and cement control.
By placing the analysis and control modules in direct proximity with each process, significant improvements in frequency of analysis and the availability of real-time data allow for both imme-diate and automatic process corrections. The principal benefits for such systems may include:
• more consistent raw mix
• lower temperature with higher free lime content
• more stable kiln operation
• significant savings on fuel
• more reactive and softer clinker for easier grinding
• significant savings for electrical energy
• improved separator control for more consistent cement particle size
• distributed in-process area modules provide significant cost savings over centralized location systems
• payback typically less than one year
REFERENCES
Haider, A., The benefits of installing a Free Lime Analyzer to Control Clinkering, Mill Session Papers, Manufacturing Technical Committee, Portland Cement Association, Skokie, Illinois, September 27-29, 12 pages, 1999.