Everything you need to know about Microscopical Quality Control of Clinker and Cement
[wpecpp name=”package” price=”75″ align=”center”]
by Donald H. Campbell*
The history of microscopical examination of clinker and cement goes back to the work of LeChatelier, a French chemist, in 1887. Using thin sections according to the methods developed by Henry Clifton Sorby, an English geologist, LeChatelier recognized the four main phases of port-land cement: tricalcium silicate, dicalcium silicate, lime-iron aluminate, and tricalcium aluminate.
In the same year, Törnebohm, a Swedish scientist provided the first major microscopical analysis from a quality-control point of view.
The recent history of cement and clinker microscopy emphatically confirms the value of routine examinations of powder mounts and polished sections, providing data and a reasonable basis for changes in process variables. The light microscope is believed to be as valuable as chemistry, x-ray diffraction, and virtually any other instrument for quality control, each instrument supplementing the other.
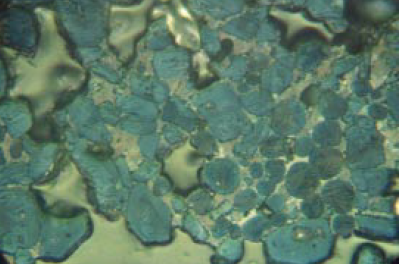
Figure 8.3.1 Highly reactive clinker in nital-etched polished section at 400X showing a somewhat nonuniform distribution of angular alite and round belite crystals in a finely microcrystalline matrix of C3A and ferrite. Although the uniformity is not ideal, the small size of the silicates is a strong positive factor in strength. Cement routinely has 28-day mortar strength greater than 47.5 MPa with a Blaine of 357 m2/kg. Cement Ono parameters: AS = 26, AB = 0.0100, BS = 25, BC = pale yellow. Alite:Belite (25- to 32-micron KOH residue) = 83%:17% = 4.9; 5.9% tightly packed belite nest fragments in plus 32-micron fraction on cement (as received). Field length, FL = 140 microns.
BACKGROUND AND ESSENTIAL REFERENCES
Emphasis in this chapter is given to the use of the microscope, viewing images in reflected and transmitted light, and demonstrating the unique power of the instrument for quality control in clinker and cement production. Microscopy for quality control in a cement-plant such as the inter-pretation of burning conditions and raw feed characteristics, clinker structure, phase distribution, and crystal sizes, requires rapid methods of sample preparation and examination. The chapter also presents the descriptions on some of the typical characteristics of high- and low-quality clinkers. A revised set of data on the interpretations of kiln performance based largely on Ono’s microscopical work and that of the author is offered. Improved methods of sample preparation to microscopi-cally study nodules and powders employing innovative methodologies are also described. Finally, some brief comments about the future of electronic microscopy and X-ray diffraction (Rietveld method) are also presented.
Four unparalleled, encyclopedic publications (three of European origin, and one from Asia) are required reading for cement microscopists. The publications are cited below. These authors, in addition to their understanding of chemistry and kiln processes, provided “picture books” illustrating many of their observations and backing up their interpretations. Their contributions are invaluable.
1. Mikroskopie des Zementklinkers, Bilderatlas, F. Gille, I. Dreizler, K. Grade, H. Krämer, and E. Woermann, (1965, Verein Deutscher Zementwerke, Germany)
2. Microstructure of Portland Cement Clinker, Friedrich Hofmänner, (1973, Holderbank, Switzerland)
3. Microscopy of Cement Raw Mix and Clinker, Erling Fundal, (1980, F.L. Smidth, Denmark)
4. Ono’s Method, Fundamental Microscopy of Portland Cement Clinker, (1995, Onoda Cement Corp., Japan)
The classical work of Yoshio Ono, beginning in the 1950s and extending to 1995, demonstrated the practicality of transmitted-light microscopy in the cement plant. Ono’s interpretations are given emphasis, though not beyond modification, in this summary of clinker and cement microscopy.
Ono brought the application of the microscope from the research laboratory virtually onto the rotary-kiln floor. Published in 1968 in the Tokyo Symposium and presented during a seminar in Hawaii in 1975 at Cyprus Hawaiian Cement Corporation, the Ono Method stimulated great inter-est in microscopical quality control, including the founding of the International Cement Microscopy Association (ICMA) in Dallas in 1980 (www.cemmicro.org).
An attempt to organize systematically the vast amount of information related to pyroprocessing variables in terms of energy consumption and quality control is found in the publications of the Japanese cement industry (mainly Yoshio Ono of the Onoda Cement Company) in the 1950s, ’60s, and ’70s. Onoda’s research, through laboratory and plant-scale investigations, was to define a set of kiln processes, with parameters for each, in order to streamline (make production energy-efficient) and take some of the mystery out of quality control of clinker, and thereby portland cement. Waiting for mortar strength tests is no longer necessary. We now have a technique to evaluate the clinker immediately after production, prior to grinding into cement.
Originally, kiln personnel (kiln burners) were trained to use the microscope. A set of microscopical parameters was routinely evaluated and the data included in process equations for quality control. The fact that these microscopical parameters have very high correlation coefficients in such equa-tions gives microscopy a status little appreciated in the past.
Recent schematic descriptions of the manufacturing processes in Taiheiyo plants (previously part of Chichibu-Onoda) indicate the frequent use of microscopy, among other tests, to maintain qual-ity (Uchikawa, 1992). Tight control on clinker phase composition, potentially quite variable due to the extensive use of waste materials in Japanese cement manufacturing, requires constant attention to chemical and microstructural detail. Both light and electron microscopy are utilized, the latter for phase elemental analysis. Clinker pore volume, determined with a mercury intrusion porosimiter, is a critical data point, as is the occurrence of reducing conditions. If certain micro-scopical quality-control targets, based on Ono’s method, as well as other process targets, are not met in Taiheiyo plants, the clinker is recycled until the designed characteristics are attained.
ONO’S METHOD
Ono’s Method (Ono, 1995), as it is defined and used by the Chichibu-Onoda Cement Company, is seen to be a combination of transmitted- and reflected-light techniques (not just transmitted light as the method was originally described).
In Ono’s research the principal kiln factors and microscopical parameters are:
Kiln Factor
Rate of heating
Maximum temperature
Time at high temperature
Rate of cooling
Parameter
Alite size
Alite birefringence
Belite size
Belite color, morphology
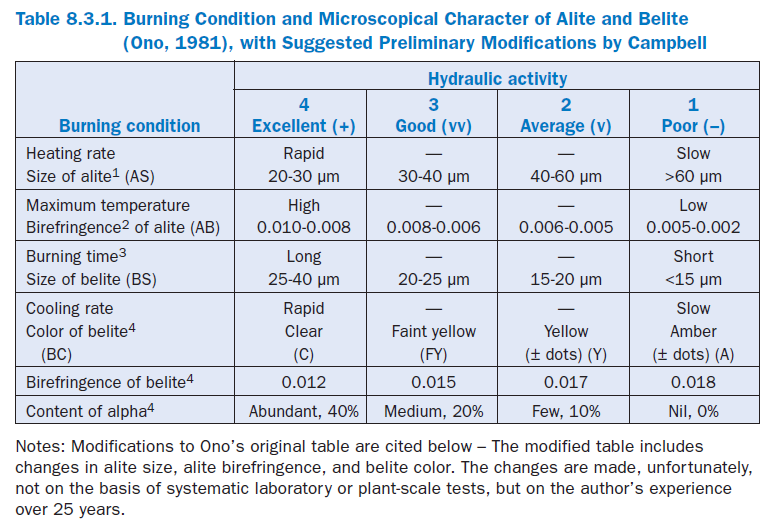
Here we find the translation of the thermochemical changes of raw meal into clinker by microscopical observations relating to a set of process variables, and applicable to virtually any cement kiln. These basic concepts provide a practical frame of reference on which a quality control program can be partly based. Ono’s original table for interpreting the burning conditions and hydraulic characteristics of cement and clinker, modified by the present author, is presented in Table 1.
1. An alite size range of 15 to 20 µm appears almost nonexistent in modern well-burned clinker, suggesting the possibility that the attainment of such sizes is not practical. Cements with normal finenesses produced from these clinkers typically have quite acceptable setting char-acteristics and 28-day strengths above 47.5 MPa.
2. Alite birefringence in Ono’s original table was not a continuous series of numbers. A birefrin-gence of 0.0075, for example, fell between the high and moderately high temperature cate-gories. Therefore, the boundaries were slightly modified to make a continuous series. Preferred crystals are 12 to 25 microns wide.
3. Minimum belite size of 25 microns in the well-burned category might be reduced to 20 microns, pending further research.
4. Belite color, for the moderately slowly and slowly cooled categories, was combined with abun-dant dot-like inclusions from exsolution, said by Ono to indicate slow cooling. Dots are not always present. Alpha-polymorph percentages, said to be functions of cooling rate, are believed to be far less than those in Ono’s original table, and with belite birefringence, addi-tional research is needed.
If MgO in clinker is higher than 1.8%, birefringence of alite in the Table 1, according to Ono, is increased by 0.001. If MgO is less than 1.2%, birefringence is decreased by 0.001.
Some would say these factors used for clinker evaluation are simplistic because pyroprocessing variables are far too complicated to be evaluated with only four parameters. Raw feed particle size, burnability, type of fuel, the effects of minor elements, the cement type (ordinary, sulfate resisting, oil well, etc.), are indeed relevant and no disregard for these variables is implied. Ono’s microscopical, four-factor theory of kiln control has been successfully used in many plants. Usage varies in frequency, as some find that other methods of quality control will suffice.
Rapid rate of heating, a sufficiently long time at high temperature, an adequately high maximum temperature, and a rapid quench, entrapping isomorphic and other crystal structure impurities, are believed to be critical to optimizing potential hydraulic response in a cement. One of the fundamental reasons for optimizing these parameters in the clinker is the development of an optimum surface area on a phase-by-phase basis, such that when the clinker is ground, the required surface area of alite, for example, is made available for hydration.
Ono’s latest equation (1995) for 28-day mortar-cube strength, F(28d), routinely used in quality control, is:
F(28d) = 25.309 + 0.513AS + 2.027AB + 0.334BS + 2.179BC
where,
F(28d) = 28-day strength (MPa)
AS = alite size,
AB = alite birefringence,
BS = belite size, and
BC = belite color
Each parameter is stated in terms of the factor-ranking numbers 1, 2, 3, or 4, in Ono’s table of kiln interpretations.
Standard deviation is 1.67 MPa for the strength range of 29.42 to 44.13 MPa.
Two recommendations by Jack Prout (previously of St. Marys Cement in Ontario) are: 1) that the predicted strength be considered an “index number” without units; the number would still be a quantitative value suitable for statistical calculations and relative comparisons, and 2) correlations might be better with the 7- to 28-day increase in mortar strength.
Rate of Heating
Generalizations regarding specific heating rates cannot, as yet, be accurately made. Many investiga-tors have described the effects of heating rates in laboratory experiments or plant-scale studies, however, as stated above, not everyone agrees as to the importance of heating rate. Coarse raw feed exerts a major influence on alite crystal size in many plants, but the relationship is not consistent. For example, a few kilns burning a coarse feed produce a finely microcrystalline clinker, and vice versa. However, within any single kiln system, assuming a reasonably constant raw feed fineness, changes in alite size appear to be mainly a function of heating rate which is likely to be kiln specific. A rapid heating rate is preferred.
Measuring alite and belite sizes in a clinker or cement powder mount with transmitted light seems to be unusually difficult, compared to polished sections. Therefore, polished nodule sections, or polished grains mounts of the cement (>32 µm), providing a sharp delineation of the crystals, are the preferred methods for crystal size determination.
Maximum Temperature
The maximum temperature must be high enough for combination and incorporation of impuri-ties in the crystals, especially in alite, since it is the most important volumetrically and chemically. For any one raw feed with its characteristic burnability, the optimum temperature is sought, i.e., the temperature which promotes the highest degree of combination and hydraulic reactivity at a reasonable expenditure of energy. In this regard, Ono states that his method is particularly valu-able during start-up, when one is microscopically establishing the optimum maximum tempera-ture. Excessive heat produces alite with a lower reactivity, that is, a lower strength in the mortar (Long, 1983). Determination of the birefringence must be done with transmitted light.
Time at High Temperature
Belite left over after the conversion to alite, and not encapsulated in the latter, is believed to grow during its passage through the high temperature zone, with most of the crystal growth occurring above approximately 1400°C. Belite polymorphs formed earlier during heating convert to the alpha form at high temperature, simultaneously taking in most of the various elemental impurities which are said to strain the crystal lattice, and thus promote hydraulic reactivity. Belite sizes are measured with reflected light in polished section.
Variations in crystal chemistry, indicated by the complex chemical and structural changes within the growing crystals in any clinker, suggest the difficulty of attaining equilibrium in an industrial situation. Clinkers are heated and cooled rapidly in order to produce crystal strain from the entrapped elements in and around crystal lattice positions. It seems doubtful that a high degree of equilibrium is established in a cement kiln. Indeed, the lack of equilibrium may promote phase instability and thus hydraulic potential.
Cooling Rate
Retention of “impurities” in belite, promoting crystal strain, is enhanced by rapid cooling, according to Ono and Soda (1965). Ono showed convincingly that belite color is related to rate of late strength gain, the color produced mainly by exsolved materials. Iron is the primary colorant and has been observed to form beside the lamellae during exsolution and slow cooling. Extensive exsolution dur-ing cooling lessens belite reactivity. However, recent work (Campbell, 1999b) indicates the occur-rence of clear belite with lamellar extensions in slowly cooled clinkers. Also, iron- and manganese-rich raw mixes tend to produce yellow-tinted belite, particularly in class H and G oil-well cements. In these cases one should defer to crystal morphology for the cooling rate interpretation.
To minimize some of the difficulty in belite color definitions among microscopists, color judg-ments for cooling-rate interpretations with transmitted light can be reduced to two categories:
1) clear and pale yellow crystals with thin multidirectional lamellae, interpreted together as quickly to moderately quickly cooled, and 2) yellow + amber + crystals with abundant dot-like impurities (heterogeneity), or the occurrence of lamellar extensions (longer than 1.0 micron), or both, inter-preted as slowly cooled. Polished sections normally facilitate the observation of lamellar extensions and recrystallized belite in which the previous lamellae are largely destroyed (see Campbell 1999a), microstructures believed to form during slow cooling (Fukuda and others, 1993).
CHARACTERISTICS OF HIGH- AND LOW-QUALITY CLINKER
Nodule size gradations in a well-made clinker for construction cements are those that promote grinding. Generally poor gradations, unusually large clinkers, and an abundance of dust make a less-than-optimum grindability (Wolter, 1985). Small nodules with sizes of approximately 3 to 30 mm and uniform microstructures are easier to grind than nodules with an extremely wide range of sizes and varied internal structures. A well-made clinker nodule has a uniform distribu-tion of generally small crystals and a well-developed microporosity within the matrix, both of which improve grindability, and, ideally, produce cement particles the phases in which have a uniform potential for exposure to water during hydration. A uniform clinker microstructure, therefore, aids in developing a consistent, day-to-day, effective phase-surface area available for water exposure in the cement. Cement derived from a uniform clinker is believed to promote consistent engineering characteristics. With well-made cements, the admixture response is con-sistent, as is workability and rate of strength gain, among many other physical and chemical properties. A well-made cement gains a reputation of dependability, critical for success in the marketplace, but only that degree of “perfection” in clinker microstructure that provides a depend-able competitive product is required.
Probably the most obvious characteristic in poorly made clinker is its extreme nonuniformity of phase development and distribution. Nodule-to-nodule variation is also high, and dusty clinker is common. Poorly made clinker commonly contains abundant free lime (arbitrarily defined at greater than 1.75%), silicates with a wide range of crystal sizes, alite chains, a high percentage of belite nests with crystals tightly packed, belite rings, belite lamellar extensions into the matrix, and evidence of reducing conditions. A high porosity (low liter weight) is common in poor-quality clinkers. Clinkers are generally termed “poorly burned” (sometimes incorrectly) if their micro-structures are correlated with low-strength cements.
Admixture responses in cement made from poorly burned clinker can be frustratingly variable. Water demand can be high (or unpredictable) and workability may range from false set to extremely retarded. Low rates of strength gain are commonplace.
In terms of Ono interpretations, poor quality clinker would be that made with a slow heating rate to a relatively low maximum temperature, a short time at that temperature, and slow cooling. Widely ranging chemical and physical test data tend to correlate with the microscopical interpreta-tion of poor cement quality.
Examples of acceptable and poor quality clinkers are seen in Figures 8.3.1 to 8.3.5. A setting time problem is represented in Figure 8.3.6. The problems were mainly manifested in terms of low mortar strength.
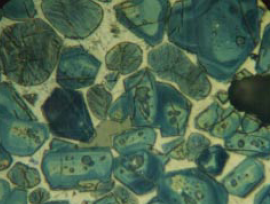
Figure 8.3.2. Clinker polished section with a nital etch at 400X, showing uniformly distributed silicates and a finely microcrystalline matrix of aluminate (C3A) and ferrite, the latter dominant. AS = 54, AB = 0.0089, BS = 31, BC = pale yellow to yellow. Alite:Belite (25-32-micron KOH residue) = 90.1%:9.1% = 9.9. One belite nest fragment with tightly packed crystals in 409 grains of the 32- to 75-micron fraction of crushed clinker. ICMA Sample Exchange Program, Sample #67. FL = 140 microns.
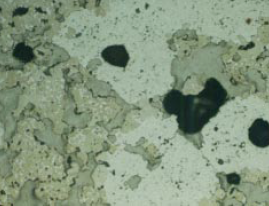
Figure 8.3.3. Poorly burned (underburned) clinker in water-etched polished section at 100X, showing strong nonuniformity. Belite is found almost totally in nests, many tightly packed and with central voids, indicating coarse quartz and very high porosity. AS = 22, AB = 0.0092, BS = 12, BC = yellow. Alite:Belite (25- to 32-micron KOH residue) = 7.3; 7.2% tightly packed belite nest frag-ments in 32- to 75- micron fraction of crushed clinker. FL = 140 microns.

Figure 8.3.4. Slowly cooled, extremely coarsely crystalline clinker from unusually coarse raw feed having 15.3% > 125 microns (of which 14.6% is limestone) and 3.8% acetic acid insolu-ble residue (of which 2.9% is coarse quartz > 45 microns). AS = 90, AB = 0.0050, BS = 42, BC is yellow with abundant dot-like impurities. Alite:Belite = 2.57; 1.3% belite nest fragments with tightly packed crystals in the 32- to 75-micron fraction of crushed clinker. Predicted 28-day mortar strength = 33.4 MPa; actual strength = 35.6 MPa. FL = 140 microns.
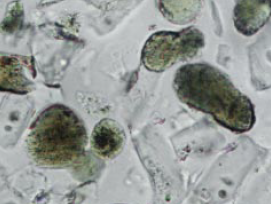
Figure 8.3.5. Same clinker as in Figure 8.3.4, but in powder mount with refractive index liquid n=1.715, showing yellow, inclusion-choked belite in the 25- to 32-micron fraction of the KOH-sugar insoluble residue. FL = 0.18 mm.
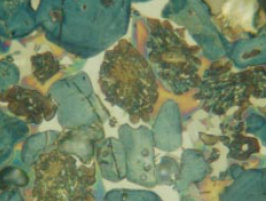
Figure 8.3.6 Polished grain mount of poorly made clinker particles (1.0- to 2.0-mm diame-ter) in epoxy on a glass microscope slide with a nital etch superimposed on a water etch. Rapid setting times and variable admixture responses were noted in the cement. The particle shows large multicolored zoned
aluminate (C3A) in the matrix and belite with “satellite” crystals from very slow cooling. FL = 140 microns.
Failure of a nodule to show “ideal” characteristics does not necessarily make it poor quality in terms of cement performance. Caution should be used in unqualified application of these criteria for poor clinker quality because of the variability in the criteria themselves. Each criterion has a different, sometimes variable, “weight” in terms of influence on the cement performance. Clinkers having only some of the above characteristics of poor quality should not necessarily be looked upon as totally unacceptable, because for certain markets cements from such clinkers can be ground into a quite satis-factory product. A strongly negative influence for one criterion (for example, alite size) in Plant X may not have the same degree of effect due to strongly beneficial crystal chemistries in Plant Y.
Clinkers with approximately 25% belite, 30% of which occurring in nests of tightly packed crystals, might at first glance be classified as unacceptable. However, because the remaining 70% of the belite is uniformly scattered as isolated single crystals in the nodule, the late-strength gain is rapid and high. Nests with tightly packed crystals, if sufficiently abundant, say, 30% of the belite, significantly decrease late-strength gain. The microscopist must determine the microscopical abundance and dis-tribution of tightly packed belite nests and the isolated crystals before making the interpretations.
A recently used technique to estimate the percentage of belite nests containing tightly packed crys-tals in a clinker sample involves crushing some of the modal nodules to less than 75 microns and counting the tightly packed nest fragments in the 32- to 75-micron fraction. A polished section with a water, nital, or ammonium chloride etch is used in the reflected-light examination. See discussion in “Polished Grain Mounts” below.
RECOMMENDED METHODS FOR CLINKER
AND CEMENT EXAMINATION
In the author’s laboratory, slightly different procedures are used for clinker nodule versus cement examination, but both require polished sections in reflected light and study of powder mounts in transmitted light. Harris’s Method for use of a cyanoacrylate adhesive (Super Glue™) is described in Campbell (1999a). For the present chapter, recommended modifications to Harris’s Method using warm epoxy, or cyanoacrylate, and ceramic tiles are detailed first, followed by a method for cement examination, using KOH-sugar residues, polyester sieve cloths, and one-particle-thickness polished sections (polished grain mounts).
Clinker
In case of clinker examination, the following 7-step procedure is recommended:
1. Trim ceramic tiles to approximately 45×25 mm. Glass microscope slides normally require the use of an expandable slide-holder device or one with a rigid design (for example, Buehler No. 30-8005, and 69-1583, respectively). Tiles are more economical and can be comfortably held with no devices. Plastic cups are also widely used. Label backs of the tile or glass slide with a diamond scribe or indelible ink pen. Ink labeling, covered with a thin layer of cyano-acrylate adhesive, is relatively permanent,except in acetone and other strong solvents.
2. Samples of the clinkers to be examined should represent the broadly defined modal size class of the clinker nodule size distribution, that is, the particles between the 16th to 84th percentiles of a cumulative percentage curve. This size range volumetrically represents most of the cement and its performance characteristics. If necessary, the selected clinkers are crushed and sieved to produce approximately 1- to 3-mm particles in the laboratory, with a few small, pea-size, whole nodules added.
3. Align the nodules (or fragments) in rows on smooth side of tile, and apply several drops of cyanoacrylate adhesive (for example, Loctite 408™) to nodule tops and around the base of the nodules. Wait two or three minutes for initial set of base of glue, testing the bond of the nodules with a needle, if necessary, to make sure they are bonded to the tile. A low-viscosity epoxy and a vacuum jar can also be used (see discussion below).
4. Pour off the excess resin or withdraw it with the edge of a paper towel, and allow the mount to fully cure on the slide warmer.
5. Cut the sample on the Isomet™ saw, with the blade bathed in propylene glycol or non-reactive oil, and sonic clean in alcohol. Forcefully rinse the surface with alcohol in a trigger-spray bottle, and blow dry.
6. Apply one drop of cyanoacrylate to the cut surfaces of each nodule, and hasten hardening with the hair dryer. Strike off excess resin with a glass slide, razor blade, or cover glass, and allow to harden.
7. Coarse polish with 15-micron diamond, followed by 3- to 6-micron alumina (or diamond) on polishing cloth, such as Texmet™. Sonic clean in isopropyl alcohol, and do the final polishing with 0.3-micron alumina, or 0.25-micron diamond on Texmet™. Sonic clean again, rinse with an alcohol spray, blow dry, and examine. Thorough polishing results in a relatively flat, low-relief surface, allowing the observation of alkali sulfate. Note that silicon-carbide papers are not recommended because of the topographic relief retained on the section.
The procedure outlined above can also be done with a low-viscosity epoxy resin, dispensed with an eye dropper or other tool onto a hot tile or slide (hotplate at about 50°C) where it sets quickly and is immediately removed from the hotplate. Shrinkage of the epoxy from excessive temperature or curing time can cause curling and cracking of glass slides. As stated above, vacuum impregnation of the cut surfaces of the nodules is recommended with epoxy. Lapping the tile or slide surface prior to nodule attachment, roughens the substrate and promotes bond, but is normally not necessary. Several brands of low-viscosity epoxy are applicable. The main advantage of cyanoacrylate is the very low viscosity and deep penetration into the nodule, but it is soluble in acetone – epoxy is not.
Additional information regarding sample preparation can be found in Campbell (1999a).
Cement
Use of the light microscope to diagnose cement problems has not been emphasized as with clinker. One of the major difficulties in cement examination is the small size of most of the cement parti-cles. Significant data, however, can be gathered on particles larger than 10 microns.
Ono (1982) studied a series of portland cements, each with known amounts of glassy blast-furnace slag (three varieties) and gypsum (three kinds), each cement ground to 310 m2/g Blaine. Four sieve fractions of each cement were studied microscopically in transmitted light to determine their percentages of slag. A microscopical count of approximately 1000 particles of each sieve interval was required for an acceptable standard error of less than 1.0%. Ono concluded that the 20- to 40-micron sieve fraction closely approximated the total slag content in the cement. An extensive microscopical study of all or several size fractions of the blended cement to determine slag percentage was, therefore, unnecessary.
Unpublished research by the author shows that microscopical study of a restricted size range of the Cement and Concrete Reference Laboratory (CCRL) No. 136 cement gives a close approxima-tion of the slag content. Classifying and counting particles microscopically in a powder mount of the 10- to 32-micron fraction of a cement (wet sieved with alcohol) gave a slag percentage of 3.6% (see Figure 8.3.7). Study of the same bulk cement in polished section at the National Institute of Standards and Technology (NIST), utilizing a corrected chemical analysis from SEM and EDXA data, gave a percentage of 3.81% (Bentz and others, 2000).
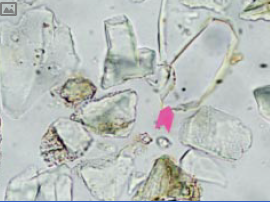
Figure 8.3.7 CCRL Sample 136, 20- to 32-micron fraction of the KOH-sugar residue in transmit-ted light. Magenta arrow points to glassy slag particle in upper right. FL = 170 microns.
It seems reasonable, therefore, that one might study one or two narrowly defined size fractions of common portland cement to determine kiln conditions, make correlations with performance data, and provide a means of evaluating cement quality. Because alite and belite make up approximately 80% of portland cement, and are responsible for most of the strength gain during hydration, the silicates are given major emphasis.
Alite to belite ratio studies are easy and fast, as several hundred crystals of a restricted size range of the silicate residue from a KOH-sugar extraction can be observed and tallied in 15 to 30 minutes in a powder mount with refractive index liquid (n = 1.715), Meltmount™ (n = 1.70), or, preferably, in polished grain mount with a suitable etch. Additionally, examination of the greater-than-32-micron fraction of the cement (as received) in polished section will provide a wealth of information about the matrix and the relationship with the silicates. This preparation is almost as informative, and much faster, than the study of whole nodules or 2- to 4-mm crushed clinker fragments.
Preparation and Examination of the Residue from a Potassium Hydroxide-Sugar Solution
By stripping away the clinker matrix, mainly aluminates and ferrites, silicate observations are greatly facilitated since their optical characteristics become strikingly easy to observe, if the particle is of adequate size. Ono calls these particles “naked silicates” and a hot KOH-sugar solution is used to concentrate them. Procedures for extracting the matrix phases and leaving the silicates as a residue for microscopical or XRD analysis have been discussed in Campbell (1999a) and are briefly reviewed here for the purpose of determination of alite birefringence, belite color, and, more recently, the alite to belite ratio (A/B). Observations are made in transmitted- and reflected-light, the latter as polished grain mounts. Particles of about the same size are required for within-sample statistical validity in percentage determinations.
Sieving with polyester or nylon mesh sieve cloth and isopropyl alcohol produces a narrowly defined particle-size range and, therefore, makes the powder nearly ideal for examination and statistical counting to establish number (volume) percentages of alite and belite. Glassy slag percentages are easily determined. Glassy slag has no cleavage, a conchoidal fracture, indices of refraction less than 1.70, and clinker phases are almost always higher. Thus the Becke Line, optical relief, and response to cross-polarized light can abe used for identification and counting. Furthermore, glassy slag does not react with nital, whereas most clinker phases do, thus identification and counting can be done with a polished section. In the unetched polished section, slag shows a subtle pink coloration (not as prominent as that for periclase) in contrast to the clinker particles.
The steps to determine the weight of a KOH-sugar residue or the weights of selected sieve fractions are described below.
A. Weigh and place approximately 2.0 grams of the cement in a hot KOH-sugar solution in a heavy duty glass beaker on a hotplate at approximately 80°C, stirring continuously for approx-imately 5 minutes. The beaker with its hot contents is placed in dish of cold water for approxi-mately 2 minutes while the mixture cools.
B. Pour the residue onto a dried and tared Whatman fiber-glass filter (0.7-micron pore size), in a Buchner funnel attached to a vacuum line, and rinse the residue with water, giving final rinses with isopropyl alcohol. To facilitate the filtration, use a 2.7-micron fiberglass filter below that with the 0.7-micron pore size.
C. Dry the residue while on the tared filter on the slide warmer at no hotter than 60°C, weigh and calculate the approximate percentage of silicates in the cement.
D. Using a small brush, such as a baby’s tooth brush, collect and weigh the residue in a tared heavy duty beaker, and add a few milliliters of isopropyl alcohol. Sonicate for approximately 2minutes to break up some of the lumps. A surfactant may be helpful in this step but tests are needed. To facilitate separation of the particle sizes, the handle of the tooth brush, with the aid of boiling water, is bent to a right-angle position, enabling its insertion into the sieve and movement across the cloth.
E. To remove a selected size fraction, say, particles in the 25 to 32-micron range, the residue is wet-sieved through tared polyester mesh sieve cloths with alcohol. The sieve cloths are gently stretched between nested brass or plastic sieve frames (the wire cloth having been previously removed). Liquids and the less-than-25-micron material accumulate in the lower container (the pan). While sieving, a small vacuum pump line may be briefly touched to a tube connecting port screwed into a hole in the container (pan) just below the nested sieve set, thus pulling the particles through the cloth. Gentle brushing of the particles while wet with alcohol on the sieve cloth helps to separate the particles. Additional details of using polyester mesh sieve cloth are given in a subsequent section in this chapter.
F. The retained residues are dried and weighed on each of the tared respective sieve cloths. The alcohol in the pan, containing the pan fraction, can be rapidly evaporated on a hot plate and weighed.
Weights of each sieve fraction of the KOH-sugar residue can be expressed as: 1) percentages of the total KOH-sugar residue, 2) weight percentages of the original untreated sample, or 3) some other combination.
For reuse, the polyester sieve cloth can be washed in dilute hydrochloric acid, rinsed with water then with isopropyl alcohol, and dried on the slide warmer or with a forced-air drier.
Particle Examination and Counting
Particles are counted along a line of traverse (either of the cross hairs in the microscope eyepiece), tallying only those particles large enough to be confidently identified. In practice, particles falling within the arbitrarily selected corner of the cross hair are the ones recorded. For alite to belite ratio, only those phases are tallied. The KOH-sugar residue almost always contains multiphase particles, alite + belite in a particle held together by an insoluble matrix or a “crystal-to-crystal bond.” Some particles, instead of single phases, are composite grains of alite and belite. How are the particles tallied? The author categorizes multiphase particles on the basis of the volumetrically dominant phase, neglecting fringes of belite on alite crystals. Admittedly, this is an error in the method. Ideally, each particle should be a single phase, but that is not the nature of normal port-land cement.
The number of counts of a phase (the raw data) multiplied by its specific gravity or density gives the corresponding mass from which the weight percent is readily calculated.
Alite and belite percentages can be expressed as: 1) simple counting percentages or weight percent-ages as gathered, 2) weight percentages of the weight of the residue size fraction, 3) percentages of the total KOH-sugar residue weight, or 4) the original weight of the sample (untreated), or 5) by other combinations.
The alite to belite ratio (preferably a ratio of weight percentages) as described above represents only the arbitrarily selected size range of the KOH-sugar residue.
Correlation likely exists between quantitative x-ray diffraction percentages (Rietveld method) of the bulk cement, sieved fractions, permitting a numerical correction to the microscopy. Perhaps sieving out the modal size fraction of the cement might be a practical standard for routine investigations. Research by the author along these lines is presently incomplete.Further discussions about quantitative microscopy are briefly discussed in Campbell and Galehouse (1991).
In order to determine the apparent birefringence of alite and belite color, according to Ono, trans-mitted light is required. A representative portion of the selected size fraction (10 to 32 microns, for example) is placed in a refractive index liquid, epoxy, or, better, Meltmount™ on a glass micro-scope slide. Choosing the proper alite crystals (whole or nearly whole crystals with an approximate 2:1 length-width ratio and bright interference color in cross-polarized light), determine the appar-ent birefringence on at least 10 crystals, eliminate the extremes, and calculate an average. Such crystals are normally abundant in a powder mount of the KOH-sugar residue.
Belite colors are recorded by estimating (or counting) the crystals in five categories: clear, pale yellow, yellow, amber, and crystals with abundant dot-like impurities, the latter two categories having the same interpretation—slow cooling. Ono’s Method is discussed in detail in Campbell (1999a). Problematic aspects of belite color observations are described in Campbell (1994).
If lumps of material in the KOH-sugar residue are problematic, immerse the powder again in alcohol in a beaker placed in a sonic device, the beaker surrounded by water, and sonically vibrate for approximately 2 to 3 minutes. A rubber policeman and a brush are sometimes helpful to break up some of the lumps during sonication, as are certain surfactants.
Not all the silicates are separated by treatment in the KOH residue, not even after sonic treatment and gentle brushing through the polyester sieve cloth, or after an 8-hour KOH treatment at approximately 80°C. Research into what holds these clustered particles together is needed. Perhaps it is glass or a minor crystalline phase normally undetected by XRD.
Perhaps a better method to estimate the percentage of silicate phases is to calculate the soluble material (largely silicates) resulting from the salicylic acid-methanol extraction (SAMX). Nevertheless, a KOH-sugar residue is required for silicate examination.
Polished Grain Mounts
Particles mounted in epoxy, the tops of the grains polished, are common in SEM studies, particu-larly in ore microscopy. The plane of the polished surface passes roughly through the middle of the particle, and the grain is polished on only one surface instead of two surfaces as in a doubly polished thin section, hence, the grain mount may be termed a “half section.” With a one-particle-thick layer, cement grains can be examined in reflected or transmitted light (or both simultane-ously) in a polished grain mount of particles in epoxy or cyanoacrylate. Transmitted light allows observations in three dimensions, but reflected light gives only a planar (two-dimensional) view. Both have their phase-characteristic advantages.
In this method, the glass slide is placed on a puddle of epoxy containing cement particles, instead of a puddle placed on the slide. The puddle is prepared on non-stick paper, the backing from an adhe-sive-backed polishing cloth, for example, and the excess epoxy is squeezed out with finger pressure on the glass slide. Grain mounts require no lapping with silicon-carbide papers, only coarse and fine polishing. A No. 2 rubber stopper affixed with Super-Glue™ to the back of the microscope slide facilitates holding the slide to the horizontal polishing wheels; the stopper is removed with a single-edged razor blade after final polishing or etching. If no transmitted-light observations are planned for the section, then a ceramic tile can be used instead of a glass microscope slide.
An arbitrarily silicate-grain size range, say, the 10- to 32-micron fraction of the KOH solution residue, or the plus-32-micron fraction of the cement (as received) can be studied. Warm de-ionized water, 0.01% aqueous NH4Cl, HF vapor, nital, cyclohexane diaminetetraacetic acid di-sodium salt (Hexaver Chelant), abbr. “CDTA,” all having slightly different etch effects, have been used. Research to confirm the application of a 0.01% aqueous NH4Cl etch-color chart, published by Uchikawa (1992) to evaluate the “degree of burning” or “reactivity” of alite, is in progress. Perhaps a solution of dilute CDTA may also suffice for this purpose. Polished grain mounts are made as follows:
1. Place a very small amount of the selected cement size fraction on a non-stick surface, such as the interior surface of the slick backing papers on Texmet™ or Kempad™ (adhesive-backed polishing cloths).
2. Disperse the grains with a blunted instrument (rounded nail, toothpick, etc.), and place a small drop of epoxy over the grains.
3. Place a cleaned, labeled glass microscope slide over the puddle. Use gentle finger pressure to squeeze out the excess epoxy, which hardens along the edges of the slide. The mixture is pressed and smeared around with the glass slide to make a one-particle thickness.
4. Place a weight on the slide while the epoxy cures on the slide warmer. The clinker particles accumulate at the base of the epoxy, thereby making a grinding step with silicon-carbide paper unnecessary.
5. Trim the excess hardened epoxy at the edges of the slide with a razor blade.
6. Polish on polishing cloth such as Texmet™ or Kempad™ with 15-, 6-, and 0.25-micron diamond, successively, using propylene glycol or nonreactive polishing oil as the liquid. The first step is primarily for thinning the grain mount until broad cross sections of individual particles can be seen under the microscope. No thin-section machines are required. The entire prepara-tion of the specimen surface can be done on a horizontal polisher-grinder. In the final stages of polishing, seeing the particles with the naked eye is normally difficult, therefore frequent check-ing with the microscope is necessary until the desired degree of polish is attained.
Polishing a grain mount on a glass microscope slide in the author’s laboratory requires a work time of approximately 20 minutes. Most of the time is devoted to minimizing the topographic relief between the particles and the epoxy.
The use of simultaneous transmitted and reflected light (Campbell, 1999b) on a polished grain mount provides characteristic optical features with two modes of light, aiding in identification of phases (Figures 8.3.8 and 8.3.9). Reflected light alone provides only a two-dimensional view, but trans-mitted light allows one to observe almost the whole crystal and its characteristics in crossed polars. These combined features are particularly valuable in identifying grains in a determination of alite to belite ratio with a polished grain mount. Strain in the heat-treated epoxy may at times be a problem in cross-polarized transmitted light, therefore making the entire grain mount at room temperature is recommended.
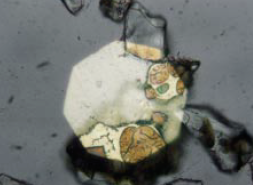
Figure 8.3.8 Polished grain mount of cement particles (>32 micron, as received) indicating a high degree of uniformity of phase distribution, coarsely crystalline clinker, at 400X. Nital etch. Raw feed is unusually coarse. 28-day mortar strength = 32.4 MPa (4780 psi), with a Blaine of 339 m2/kg. AS = 60, AB = 0.0059, BS = 30, BC = pale yellow. Alite:Belite (10- to 32-micron KOH residue) = 4.0; 4.3% tightly packed belite nest fragments in the >32 micron fraction. Combined transmitted and reflected light. FL = 140 microns.
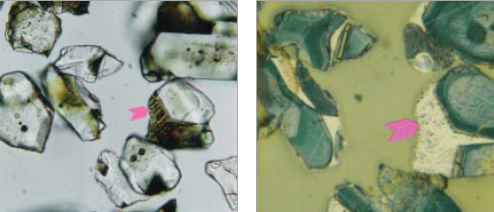
Figure 8.3.9 Polished grain mounts of the greater-than-32 micron fraction of ICMA Sample Exchange Program, Sample #69, at 400X. In transmitted light (left), with no cover glass, the view is three-dimensional, while that with reflected light (right) on the same area is two-dimensional. Each mode provides valuable observational data not provided in the other. Arrows point to same crystal in each view. FL in transmitted light = 200 microns; FL in reflected light is 100 microns.
If one is not interested in using both transmitted- and reflected-light observations on the same particle, then an ordinary polished section can be made by pouring epoxy over cement grains in the bottom of a small plastic container and polishing until a suitable number of grains have been exposed for routine examination.
Belite in polished section is identified by its characteristic etch color, or in the case of warm deion-ized water (10 to 15 seconds at 50°C), the lack of coloration compared to tan alite. Note that small round belite crystals typically occur within alite, a helpful identifying relationship when studying the particles.
Study of the greater-than-32-micron fraction of the cement has been found helpful in measuring the percentage of tightly packed belite nest fragments which, if sufficiently abundant, can decrease late-strength gain. A tightly packed belite nest fragment is defined as an assemblage of belite crys-tals, most of which are in intimate contact with their neighbors, the assemblage making up a dominant area of the particle. Simple counting of such fragments can be done with a powder mount in refractive index liquid, but preferably a polished grain mount, making the matrix easily observable. Two categories are tallied – tightly packed belite nest fragments and “others.” Recording 300 to 400 grains in this manner normally requires no more than 20 minutes. Similarly, percentage of glassy blast-furnace slag can easily be determined in a polished grain mount of the 20- to 40-micron fraction and correlated with the bulk slag percentage.
A polished grain mount of the >32 micron fraction of the cement (as received) is also particularly useful for observing details of the silicates, crystal size, matrix, free lime, periclase, and alkali sulfates. Number and weight percentages can be determined by counting several hundred alite and belite crystals.
Systematic phase abundance comparisons of the modal-size fraction of the original cement with similar particle sizes of the KOH-sugar residue have not been published, nor have correlations between alite to belite ratio, determined microscopically, and cement performance. Research on the application of a selected range of cement-particle sizes for microscopy is presently underway by the author to establish correlation between alite to belite ratio (A/B) and numerous physical parameters of the cement such as surface area, particle-size distribution, and its broadly defined modal class, including setting time, strength, and water demand.
Data from study of polished grain mounts are normally combined with that from the normal “Ono” powder mount particles in a refractive index liquid.
Preliminary studies of two cements with high and low 28-day strengths, respectively, (Table 2), and several other cements, were recently undertaken by the author. Silicate crystal size, percentage of tightly packed belite nest fragments, and alite to belite ratio help to explain the late-strength differ-ences (Figures 8.3.10 – 8.3.14).
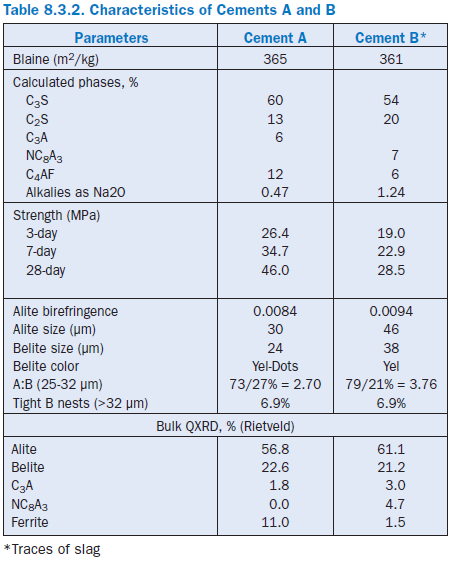
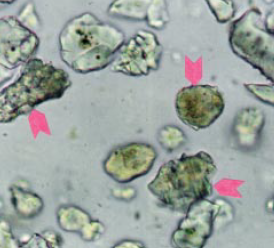
Figure 8.3.10 Typical powder mount to deter-mine alite to belite ratio in the 25- to 32-micron fraction of the KOH-sugar residue in Cement A (upper) at 400X. Some of the belites are indi-cated with arrows. Grains along one of the cross hairs (not pictured) are identified and tallied to establish the ratio (Table 2). FL = 200 microns.
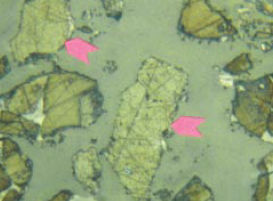
Figure 8.3.11 Polished grain mount to deter-mine alite to belite ratio in the 25- to 32-micron fraction of the KOH-sugar residue in Cement B at 400X. The section has been etched for 15 seconds with 0.01% aqueous ammonium chloride, darkening the alites. Belite is indicated with arrows. Percentages of alite and belite are quickly determined by counting grains along one of the cross hairs (not pictured). FL = 200 microns.
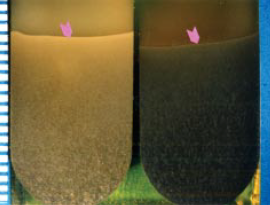
Figure 8.3.12 Longitudinal polished sections of centrifuged samples of relatively high-strength Cement A (right) and relatively low-strength Cement B (left). The hardened centrifuged encapsulations, representing equal weights of cement (3.00 grams) in each test tube, were immersed in a container of epoxy, side-by-side, cut, and polished. Note the difference in top level (arrows), believed to be merely due to particle size differences (the coarsely ground cement having the larger volume). Blaine surface areas of Cements A and B are nearly identical (Table 2). Millimeter scale divisions.
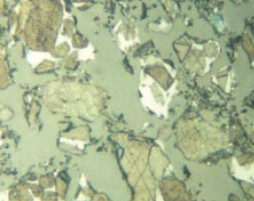
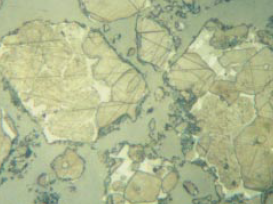
Figure 8.3.13 Polished section of relatively high-strength Cement A (left) and low-strength Cement B (right) at the 4-mm level above the base in the centrifuged samples. The sections were etched simultaneously for 15 seconds with 0.01% aqueous ammonium chloride, darkening the alites more in A than B. Note the much larger crystal and particle size in Sample B. 400X, FL = 140 microns.
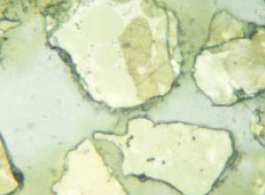
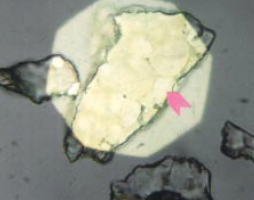
Figure 8.3.14 Polished grain mounts of the greater-than-32-micron fractions of Cement A (left) and Cement B (right) in simultaneous transmitted and reflected light, facilitating identification of crystals. The sections were etched simultaneously with warm distilled water. Note fragment of tightly packed belite nest (arrow) in Cement B. FL = 200 microns.
Sieving with Polyester Sieve Cloth for Microscopy and Particle-Size Distribution
Portland cement and many other powders can be divided quantitatively into size fractions using a stack of brass sieves, the wire cloth having been removed and replaced with tared polyester mesh, the latter acknowledged not likely to be precisely equivalent. Isopropyl alcohol, small brushes, and a vacuum line are needed for most materials. The lower sieve is tightly seated in a plastic container into which a vacuum port has been attached on the side. In the author’s laboratory, 76-mm diame-ter sieves and a 400 ml plastic container are utilized.Sieve-cloth openings are commonly 45, 32, 20, and 10 microns.
Approximately 2.0 grams of cement are placed on the uppermost sieve cloth. A small brush (baby’s tooth brush) and isopropyl alcohol in a trigger sprayer are used simultaneously to gently separate particles and concentrate them by size on their respective sieves. Gradually working downward through finer and finer sieves with the brush and alcohol, washing the brush with the alcohol as the sieve interval is finished, all the fractions are separated. While brushing, the vacuum line is gently touched perodically to the port to draw the alcohol and particles through the sieves. When one is satisfied that the particles on a sieve cloth represent that size fraction, the cloth is removed and placed on the slide warmer set at 45 to 50°C. In 2 to 4 minutes the powder is dry and the cloths with their retained size fraction are weighed, and the powder weight is calculated by subtraction.
Errors in polyester-mesh sieving do not, at the moment, render the method a suitable substitute for other instrumental techniques for particle size distribution determination, but promising research in technique is in progress. Particles representing each size fraction, however, can be stud-ied microscopically, chemically, with x-ray diffraction, and many other ways.
Cement Sulfate Examination
Quantitative abundances of various sulfates in a cement are easily determined with microscopy. As with slag, microscopical study of a selected size fraction of the sieved cement is believed to provide sulfate phase percentages correlative with bulk data.
Percentages of sulfate types (gypsum, plaster, and anhydrite) are made with a selected, alcohol-sieved fraction of the cement in a powder mount with a refactive-index liquid of approximately 1.56, tallying the number of sulfate-mineral grains above or below this index. Particles with refrac-tive index less than 1.56 are likely gypsum (defined by its common rhombic-form cleavage, low refractive index, and, typically, a complex finely microcrystalline structure). Those grains above 1.56 are either (1) plaster typically having the microstructure and cleavage of gypsum, but a higher refractive index, or (2) anhydrite, almost always showing clear-cut optical characteristics (cleavage at right angles, interference colors of the seacond order, simple uniform structure, etc.). Indices of refraction of plaster are close to 1.56, therefore the particles have relatively low optical relief in the powder mount. Most epoxies have indices in the range of 1.56 to 1.57 and can be used for perma-nent powder mounts. A temporary powder mount can be made with epoxy without the hardener.
Grains containing a gypsum core with a plaster exterior are common, indicating partial dehydra-tion of the gypsum in the grinding mill. The softness and easy cleavage of sulfates such as anhy-drite, gypsum, and plaster tend to promote their high degree of grindability, thus their accumulation in the finer grain sizes of cement.
Centrifuged Cement
Precise particle size distributions of the whole cement can be determined with Sedigraph™, Malvern™, Microtrac™, or other equipment, or by microscopical estimation on the polished section of the centrifuged sample, the latter showing the relationship between clinker crystal sizes and cement particles. All portland cements, to the author’s knowledge, contain particles of two types: 1) composite grains with more than one phase and 2) particles comprised of only one phase. The terms “polyphase” and “monophase”are also suitable. Composite particles make up the bulk of cement coarse fractions, arbitrarily defined as larger than 32 microns. Single-phase particles (mainly alite and belite) dominate the fine fractions; however, in cements with significant amounts of tightly intergrown aluminate and ferrite, many of the fine-fraction particles are composite matrix fragments. Coarsely crystalline clinkers normally produce cements with a higher propor-tion of single-phase particles than finely crystalline clinkers.
A size- and density-graded material is strikingly revealed in the centrifuge technique after spinning in a low-viscosity epoxy (Campbell, 1986). The test tube containing the hardened encapsulation is cut longitudinally, down the middle, the cut oriented so that the top of the cement in the cross section is perpendicular to the sides of the test tube, and polished. Particles with a narrow size range can be easily studied with this technique. The procedure is:
1. Wash a representative sample of the cement, approximately 3 grams, with alcohol or acetone, gently massaging the grains with a rubber policeman, and allow to dry.
2. Mix cement with a low-viscosity epoxy, place in a test tube in a centrifuge, and spin at approx-imately 3400 rpm for 20 minutes.
3. After the epoxy is hardened, cut a longitudinal section through the encapsulated cement with the Isomet™ saw, or equivalent saw, then polish in three steps with diamond and alumina powders (15-, 6-, and 0.25- to 0.30-micron sizes).
The polished section clearly reveals a size- and density-graded cement sample, with larger, heavier, normally multiphase particles at the base of the test tube with finer particles, mostly single phase, at the top of the accumulation. Large particles, say those over 32 microns, are used to decipher the matrix microstructure, and relationships between silicates and the matrix. Using the eyepiece micrometer in the microscope, one might arbitrarily select that level in the polished section, repre-senting the modal particle-size normally determined by other methods, such as the Malvern™ device. Moving the field of view transversely along a “line of constant grain size” allows the study of many particles of that size as if it were a sieved fraction. With finer grain size, the particles tend to become monomineralic, except the matrix particles, which are normally multiphase in much of the fine fraction. Most of the cement sulfate particles are readily seen to be concentrated in the fine fraction. Microscopically observing the particles of a specified diameter is easy in polished section. Thus, phase abundances at various levels in the section can be estimated by counting suitably etched particles.
Raw feed and granulated slag can also be examined in a polished thin section of a centrifuged sample. Centrifuged samples likely will find application in particle-size studies with image analysis, or phase abundance determinations with the scanning electron microscope, or other investiga-tions. Hollow spheres of glass in fly ash, however, present a problem in the centrifuge method because the particles float in the epoxy.
EXAMINATION WITH THE SCANNING
ELECTRON MICROSCOPE
Examination of clinker or cement sometimes requires different microscopical equipment for solv-ing problems. A scanning electron microscope (SEM) in backscatter or secondary electron imag-ing, coupled with energy dispersive x-ray analysis, or microprobe, can provide a wealth of information about crystal abundance, size, and composition.
Gouda (1979) describes the application of the SEM to the solution of “practical” problems. For the most part, unfortunately, the instrument is currently being used only in a research capacity. Use of the SEM on a daily basis in quality control is rare, if not nonexistent. Nevertheless, in the author’s opinion, the SEM with chemical and image analysis capabilities probably could provide reliable, time-efficient, and immediately applicable data in quality control of clinker and cement. For exam-ple, the distribution of particle sizes and phases in a polished section of cement seems particularly amenable to analysis with the SEM, as does the description of silicate crystal size variations in clinker. Recent work by Bentz and others (2000) shows promise in SEM characterizations of cement, correlating the data with performance.
Some of the same data can be gathered with the light microscope, but compositional information is limited. Light microscopy is, by far, the most economical method, requiring much less expense and very little maintenance. Some of the electronic and light-derived data overlap, that is, the same data can be gathered by both microscopical methods, and in this sense, these methods are compli-mentary. Using a polished grain mount, the location of a single crystal could be given in coordi-nate terms and the same crystal subsequently examined with the SEM. Thus light and electronic data can be gathered. A sample of clinker or cement should be examined by as many methods as it takes to solve the problem and provide a clear-cut, defensible, and precise interpretation of the results. No one type of microscope is universally superior. Each type of microscope has its advan-tages.
SEM technology in cement plants is not inappropriate. X-ray diffraction with Rietveld methods and in-line chemical analysis by XRF are already commercially available for cement-plant use. Electronic microscopical methods, coupled with software providing image analysis, can theoreti-cally provide a semi-automated method of routine quality control in the cement plants if the costs of such equipment can be reduced significantly. Not only can clinker phase characteristics be described, but cement particle size and mineralogy can be defined for analysis in day-to-day production. The present methods of wet chemistry, XRF, XRD, particle size, etc., will be replaced. Electronic methods may eventually dominate clinker and cement quality control.
For the time being, the light microscope, equipped with both transmitted and reflected light, is the preferred tool. A combination of light and electron microscopy, and quantitative x-ray diffraction, the latter with Rietveld methods, seems ideal.
ACKNOWLEDGEMENTS
The author wishes to thank José Garcia of Capitol Aggregates, San Antonio, Texas, and John Wachal of Lone Star Industries, Greencastle, Indiana, for their support in supplying samples and their helpful suggestions. Samples of high- and low-strength cements (sources not identified) were supplied from Mike Morrison of Construction Technology Laboratories, Skokie, Illinois. Quan-titative x-ray diffraction with Rietveld methods was kindly provided by Paul Lehoux of Lafarge Canada in Montreal.
REFERENCES
Bentz, D. P.; Feng, X.; Haecker, C. J.; and Stutzman, P. E., “Analysis of CCRL Proficiency Cements 135 and 136 Using CEMHYD3D”, National Institute of Standards and Technology (NIST), NISTIR 6545, 2000, 17 pages.
Campbell, D. H., and Galehouse, J. S, “Quantitative Clinker Microscopy with the Light Microscope,” Cement, Concrete, and Aggregates, ASTM, Winter, 1991, pages 94-96.
Campbell, D. H., “Particle Size Gradation with Epoxy Resin and a Centrifuge,” Eighth International Conference on Cement Microscopy, International Cement Microscopy Association, Orlando, Florida, 1986, pages 174-183.
Campbell, D. H., “A Summary of Ono’s Method for Cement Quality Control with Emphasis on Belite Color,” Petrography of Cementitious Materials, ASTM STP 1215, S.M. DeHayes and D.S. Stark, eds., American Society for Testing and Materials, Philadelphia, 1994, pages13-25.
Campbell, D. H., Microscopical Examination and Interpretation of Portland Cement and Clinker, SP030, Portland Cement Association, Skokie, Illinois, 1999a, 202 pages.
Campbell, D. H., “Weathered Clinker, Clear Belite, Alkali-Aggregate Reaction Testing, and Simultaneous Reflected- and Transmitted-Light Observations,” 21st International Conference on Cement Microscopy, International Cement Microscopy Association, Las Vegas, Nevada, April, 1999b, pages 23-39.
Fundal, E., Microscopy of Cement Raw Mix and Clinker, FLS-Review 25, F.L. Smidth Laboratories, Copenhagen, Denmark, 1980.
Fukuda, K.; Maki, I.; and Ito, S., “Transformation-Induced Microtextures in Belites,” Tenth International Congress on the Chemistry of Cement, Göthenburg, Sweden, Vol. 1, Paper 1i052, 1997, 8 pages.
Gille, F.; Dreizler, I.; Grade, K.; Krämer, H.; and Woermann, E., Microskopie des Zementklinkers, Bilderatlas, Association of the German Cement Industry, Beton-Verlag, Düsseldorf, West Germany, 1965, 75 pages.
Gouda, G. R., “Clinker Characterization by SEM,” Scanning Electron Microscopy, Vol. 1, 1979, pages 387-398.
Hofmänner, F., Microstructure of Portland Cement Clinker, Holderbank Management and Consulting, Ltd., Holderbank, Switzerland, 1973, 48 pages.
Le Chatelier, H., Constitution of Hydraulic Mortars, 1883, trans. by Mack, McGraw-Hill, New York, 1905.
Ono, Y., “Microscopical Observation of Clinker for the Estimation of Burning Condition, Grindability, and Hydraulic Activity,” Proceedings of the Third International Conference on Cement Microscopy, International Cement Microscopy Association, Houston, Texas, 1981, pages 198-210.
Ono, Y. “Microscopic Determination of Slag Content in Cement,” Journal of Research, Onoda Cement Co., Central Research Laboratory, Vol 24, No. 107, 1982, 7 pages.
Ono, Y., Ono’s Method, Fundamental Microscopy of Portland Cement Clinker, Chichibu Onoda Cement Corp., No. 2-4-2, Ohsaku, Sakura, Chiba, 285, Japan, 1995, 229 pages.Törnebohm, A. E., “The Petrography of Portland Cement,” Tonindustrie Zeitung, Vol. 21, 1897, pages 1148-1150 and 1157-1159.
Uchikawa, H., “Advances in Physico-Chemical Characterization and Quality Control Techniques for Cement and Concrete,” Journal of Research, Onoda Cement Co., Central Research Laboratory, Vol. 44, No. 127, 95 pages Also in 9th International Congress on the Chemistry of Cement, New Delhi, 1992, pages 797-876.
Wolter, A., “Influence of the Kiln System on the Clinker Properties,” Zement-Kalk-Gips, Vol. 38, No.10, 1985, pages 612-614.