Contents
Everything you need to know about X-Ray Diffraction Analysis
[wpecpp name=”package” price=”75″ align=”center”]
by Leslie J. Struble,* Luis A. Graf,** and Javed I. Bhatty***
The method of X-ray diffraction has been used for nearly 100 years to identify and characterize crystalline phases in solid materials. Because it gives information about phases, this type of analysis is distinctly different from the determination of chemical composition using X-ray fluorescence described in the previous chapter. Furthermore it is a bulk method, providing no specific information about the microstructure (that is, how constituents are arranged on a microscopic scale) as discussed in the next chapter. Nonetheless, powder diffraction is particularly well-suited to the determination of phases in portland cement1.A typical X-ray diffraction (XRD) unit used in cement analysis is shown in Figure 8.2.1. The objective of this chapter is to describe the principles of powder XRD analysis and discuss its application to portland cement. The chapter begins with a consideration of crystal structure and how crystals diffract X-rays, in part because the method depends directly on the specific ways in which X-rays interact with crystals and in part because the method provides information about crystal structure. X ray instrumentation and specimen preparation are described, and both qualitative and quantitative analyses are discussed. Applications of XRD techniques in the overall cement manufacturing operation are discussed in some detail.

Figure 8.2.1. XRD unit used in cement analysis.
There are other analytical methods that utilize X-rays, all of which have been used to study port-land cement. Each is distinctly different. Powder X-ray diffraction is used to determine the crys-talline phases in a bulk sample. X-ray fluorescence is used to determine chemical composition of a bulk specimen. X-ray analysis is commonly used during electron microscopy to determine chemi-cal composition of small selected regions of a specimen. Single crystal XRD is used to determine the crystal structure. (It is possible to refine the crystal structure using powder XRD data, but not to unambiguously determine the structure). Other types of diffraction for crystal structure analysis include electron diffraction and neutron diffraction. Finally, small-angle X-ray scattering is used to determine the surface area of a material.
PRINCIPLES OF XRD
The following sections describe the basic underlying principles of x-ray diffraction analysis, as applied to portland cement or any other crystalline material. The following major areas are discussed:
• Crystal structure
• Diffraction of X-rays by crystals
• Instrumentation
• Specimen preparation
• Analysis of diffraction data
The diffraction of X-rays is based directly on the symmetry in crystals, and so we begin this chap-ter with an overview of the structure of crystals and how atoms in a crystal interact with x-rays to produce diffraction. With that background, understanding the instrument used in this analysis is not difficult. The requirements of specimen preparation are described very generally. Finally we describe data analysis, both qualitative and quantitative, because correct and accurate use of diffraction data requires understanding this process even if it is performed by computer.
CRYSTAL STRUCTURE
Some understanding of crystallography is necessary in the use of powder diffraction analysis because the method is based directly on crystal structure. Therefore this chapter provides an elementary understanding of crystallography. Additional information may be found in reference books on crystallography such as McKie and McKie (1986) and Allen and Thomas (1999).
Crystal structure is best described using the three-dimensional arrangement of atoms or molecules in space. In a crystal, these constituents are arranged in a regular, repeating, three-dimensional geometric pattern. Sometimes crystal structure is described by the external form (also called habit), but materials without an external crystalline form may still be crystalline—that is, they may still have a regular and repeating arrangement of atoms or molecules. On the other hand, amor-phous or glassy materials have no crystal structure because their constituents are arranged in a way that does not form a regular and repeating pattern.
Lattices show the distribution of atoms or molecules in a crystal. The lattice is obtained by translational repeti-tion in three dimensions of points that represent posi-tions of atoms or molecules. The smallest repeating unit of a lattice is called the unit cell, and the entire lattice can be generated by repeating the unit cell in three dimensions. The general unit cell, shown in Figure 8.2.2, is a parallelepiped whose edges (a, b, and c) and angles (α, β, γ) are unequal. Symmetry often requires that the unit cell be less general than what is shown in Figure 8.2.2, with edges that are equal or angles that have specific values.

Of the various ways in which points may be arranged into a lattice, Bravais showed in 1848 that only 14 allow repetition in three dimensions. These lattices are shown in Figure 8.2.3. They include both primitive lattices, which have points only at the corners, and nonprimitive lattices, which have points in the center of the face or the body. The symmetry ranges from high (for cubic) to low (for triclinic). Crystallographers often describe lattices using their underlying symmetry operations.

In order to describe how X-rays interact with crystals, it is necessary to make reference to specific planes within the crystal structure. A plane is designated by the indices (hkl), called Miller indices (Figure 8.2.4). The following sequence is used to determine the indices of a plane: 1) find where the plane intercepts each crystallographic axis, 2) find the reciprocal of each intercept (to avoid introducing infinity into description of planes parallel to crystallographic axes), and 3) convert the reciprocals to integers2. From this brief discussion, it may be clear that the Miller indices have certain properties. For example, a plane that is parallel to a given axis has a zero intercept on that axis. Planes with indices that are negatives of one another are parallel and lie on opposite sides of the origin. Planes with indices (nh nk nl) are parallel to the plane (hkl) and have 1⁄n th of the spacing.

For XRD it is often necessary to calculate the distance or spacing between parallel planes. For a cubic system, this spacing is given by
![]()
![]()
It should be noted that in the cubic system the parameters a, b, and c (the lengths of the unit cell in the x-, y-, and z-directions) are equal. The formulas for other crystal systems are more complicated; these may be found in stan-dard textbooks on XRD. It should also be noted that planes of low index have large d-spacings and a high density of lattice points (illustrated in two dimensions in Figure 8.2.5).

DIFFRACTION OF X-RAYS BY CRYSTALS
In order to understand how crystals diffract X-rays, it is necessary to recognize that X-rays are waves, a form of electromagnetic radiation similar to visible light, with some characteristic wave-length and amplitude. The wavelength of X-rays is typically on the order of 0.1 nm, similar to the distance between atoms in a crystal; this similarity is why it is possible to use X-rays to probe crys-tal structures. Diffraction refers to the bending of waves by an obstacle. Waves that are diffracted by regularly spaced obstacles form a pattern: At some locations the diffracted waves are in phase, and at other locations they are out of phase. In XRD the waves are actually scattered by lattice points, but the important parameters are those that control whether the X-rays are in phase or out of phase. These are the angles between the incident and scattered waves and the spacings between points in the crystal lattice.
Angle
Consider two waves, diverging at Point A, where they are in phase, and converging at Point B. If one wave has traveled a greater distance than the other, they are not necessarily in phase at Point B. They are in phase only if the extra distance is an integral number of wavelengths; otherwise they are out of phase. In XRD, the waves diverge due to scattering; if they are in phase when they converge, it is said that the waves have been diffracted.
A single electron scatters X-rays as a point source, in all directions and with the same intensity. A single atom also scatters as a point source, although the intensity depends on a number of parame-ters. Two or more randomly positioned atoms scatter as multiple point sources that are out of phase. However, when the atoms are equally spaced in a plane, the X-rays are in phase when the angle of incidence to the plane is equal to the angle of scattering (also called reflection, though this is not a precisely correct term). If the points are not equally spaced, they do not diffract.
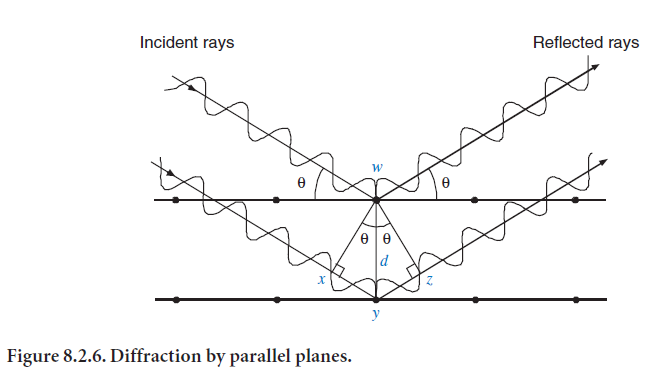
When a set of parallel planes scatters X-rays, the rays reflected by each plane are in phase if the spacing between the planes is an integral number of wavelengths (the geometry is shown in Figure 8.2.6). The two scattering planes are separated by a distance d, with reflection at an angle θ. The extra distance traveled by the wave reflecting off the second plane is xy + yz. For diffraction, xy + yz must be an integral number of wavelengths. Because xy and yz are each equal to sinθ times d, the condition for diffraction is then nλ = 2dsinθ. As noted previously, this distance d is related to the indices of the plane (hkl) and to the unit cell parameters (length of crystal axes and angles). This diffraction condition was formulated by W. L. Bragg and is known as the Bragg equation. It is a basic principle of X-ray diffraction.
Knowing the angles at which diffraction occurs, one can easily calculate d-values for the planes. Typically we measure X-ray intensity as a function of angle, with peaks whenever the diffraction condition is met. For each X-ray peak the Bragg equation allows calculation of the spacings (d-values) for those crystal planes. From the d-values and the peak intensities, it is fairly easy to deduce the crystalline phase that is producing the diffraction.
The integer n in the Bragg equation is the order of the diffraction peak. For n = 1, xy + yz =1; for n=2,xy + yz = 2; etc. However it is easier to ignore n and consider all higher-order reflections to be equivalent to reflections from planes (real or fictitious) spaced at a distance 1⁄n of the previous spacing. This principle allows us to write the Bragg equation as:
λ= 2dsinθ
where,
λ= radiation wavelength
d = distance between the scattering planes (d-spacing)
θ= angle of reflection.
Copper radiation (Cu Kα, λ = 0.154 nm) is a good choice for diffraction of most inorganic crystals. Their d-spacing is usually less than 0.3 nm.The Bragg equation indicates that there is a maximum wavelength or minimum d-spacing for diffraction. It is always necessary that sinθ be less than 1, so λ must be less than 2d. For a d-spacing less than 0.3 nm, λ must be less than 0.6 nm. This makes copper radiation a good choice.
Because diffraction of X-rays by a crystal is similar to reflection of light by a mirror, it is useful to consider whether crystals are analogous to small mirrors. The diffracted beam is comprised of X-rays scattered by all atoms that lie in the path of the incident beam, whereas reflection of visible light takes place in a thin surface layer only. The diffraction of X-rays takes place only at those angles that satisfy the Bragg equation, whereas reflection of visible light takes place at any angle.
Reflection of visible light by a good mirror is almost 100% efficient, whereas diffraction of X-rays by crystal is not efficient, the intensity of the diffracted beam is extremely small compared to that of incident beam. The diffracted beam is represented as a line, but it is really a cone. Thus diffrac-tion and reflection are quite different. Nevertheless, it is common to speak of reflection when we mean diffraction.
Intensity
A single electron scatters X-rays coherently. The incident radiation causes the electron to oscillate and the oscillation emits electromagnetic radiation in all directions and with the same frequency as the incident radiation. The amplitude of scattering by a single electron at a point P that is a distance r and angle θ from the electron is given by the Thomson equation:

Scattering is more complicated from a single atom than from a single electron. Radiation is scat-tered by each electron in the atom (the nucleus has little effect because its mass is so great), and the amplitude depends on the temperature, the nature of the bond with other atoms, and the angle. At a low angle, the amplitude is proportional to the atomic number, but at higher angles the ampli-tude decreases depending on the electron structure, because scattering from some electrons is out of phase and therefore interferes destructively. For this reason the amplitude is generally measured experimentally and compiled in tables which do not provide corrections for effects of bonding. The results are given in terms of a scattering factor (ƒ), the amplitude of the wave scattered by the atom relative to the amplitude scattered by one electron.
The amplitude of scattering by atoms in a unit cell depends on the scattering factor of each atom and on the degree to which scattering from each atom is in phase. In some cases the amplitude may even be zero. As an example, consider a body-centered cubic crystal in which all atoms are the same, shown in Figure 8.2.7. The first order reflections from the (001) planes (C) are exactly out of phase with the first order reflections from the (002) planes (C´); therefore the two sets of reflections cancel each other. The second order reflection is strong because half the distance CC corresponds to the distance CC´, so the two reflected waves are exactly in phase and reinforce each other. The example

illustrates the fact that satisfying the Bragg equation does not guarantee diffraction (although no diffraction occurs when the Bragg equation is not satisfied) and illustrates why we need to consider the degree to which scattering is in phase and the atomic scattering factors when considering what peaks to expect from a particular crystal structure.
The atomic scattering factors in a unit cell make up the structure factor for that crystal. No matter how complicated the crystal structure, it is always possible to represent the crystal as a series of interpenetrating simple lattices, one for each kind of atom, and to consider separately the structure factor for each plane in each lattice. Here it is more convenient to use exponential
notation. Let us start with scattering from two atoms. The phase angle is given by φ=![]()
![]() and is used to calculate the amplitude of the X-rays scattered by each atom. For a crystal, the structure factor F(hkl) is defined as the amplitude of X-rays scattered by
and is used to calculate the amplitude of the X-rays scattered by each atom. For a crystal, the structure factor F(hkl) is defined as the amplitude of X-rays scattered by
all atoms in the unit cell divided by the amplitude of X-rays scattered by one electron,

As shown in a previous example, in some crystal structures some planes do not reflect because the reflections are out of phase and hence cancelled by reflections from other parallel planes. Of all the crystal structures, only primitive structures with simple symmetry show all the expected peaks. Others have peaks missing (extinct) due to symmetry. It is possible to use structure factors to determine which planes give reflections and which planes do not.
The intensity of the diffracted signal is increased by multiplicity. As an example, consider the (100) reflection from a cubic crystal. In a powder specimen, some crystallites are oriented such that the (100) reflection is observed, while other crystallites are oriented such that the (010) or the (001) reflection is observed. In a cubic crystal all three planes have the same spacing and all three reflec-tions occur at the same position. Thus the reflection at that position is three times as intense as each single reflection. This increase in intensity is called multiplicity. The multiplicity factor obvi-ously depends on the specific crystal system.
The intensity of the diffracted beam is decreased due to polarization. The incident radiation is unpolarized, but the diffracted radiation is to some extent polarized, and the amount of polariza-tion depends on the diffraction angle θ. It is necessary to correct final diffraction intensity for this polarization effect. The decrease in intensity due to polarization is given by the last factor in Equation 2 (the term in parentheses).
Any peak occurs over a finite range in q, mainly because the incident beam is neither precisely monochromatic nor precisely parallel.
Therefore we generally measure the intensity by integrating the measured intensity over the full range of the peak. The value of this integrated intensity depends on the particular value of θ according to the Lorentz factor, which is given by ![]()
![]()
Two other parameters that affect the intensity of the diffracted beam are absorption and tempera-ture. As noted previously, not all radiation is reflected by the specimen. Most is absorbed. For a flat specimen, the amount of absorbed radiation is independent of θ. Temperature is important because thermal vibration, which increases as temperature increases, decreases the intensity of the diffracted beam. This decrease becomes greater as temperature increases or as θ increases.
This section describes the principles of X-ray diffraction. It is possible to use the equations given here to calculate a diffraction pattern for any crystal structure. Such calculation is useful to help understand the concepts presented here. One approach to quantitative phase analysis, the Rietveld method, is based directly on such calculation. Routine qualitative phase analysis, however, requires only a general understanding of the principles presented in this section.
INSTRUMENTATION
From the preceding section, it is obvious that we need to measure the angle and the intensity of the diffracted beam. Thus an X-ray diffractometer requires a source of X-rays, some way of detecting the intensity of the diffracted X-rays, and geometry such that we can control the angle of the inci-dent radiation and measure the angle of the diffracted radiation.
The primary X-ray beam is a highly intense source of high-energy radiation that is very damaging to living tissue. Even low intensity scattered X-rays may be damaging after accumulated exposure. Modern diffractometers are designed to be safe, to prevent damaging exposure to either primary or scattered X-rays. It is essential that the operator be familiar with all aspects of X-ray safety. Before operating any X-ray diffractometer, the user should review X-ray safety in any standard book on X-ray analysis as well as the operating instructions for the specific equipment.
Modern X-ray diffractometers utilize a computer to control the operation and to perform the analysis. Whether or not a diffractometer is controlled by a computer does not affect the issues discussed in this section but does affect the analytical procedure. Therefore computerized diffrac-tometers are not discussed in this section but are discussed in the next section on analysis.
Production of X-Rays
To be useful in powder diffraction analysis, X-rays need to have a single wavelength, a high inten-sity, and a consistent intensity. The diffractometer has an X-ray tube in which electrons strike a target material to produce X-rays. Two types are produced. One is brehmstrahlung, X-rays with a wide range of wavelengths resulting from rapid deceleration of electrons hitting the target. These X-rays are not normally used in XRD analysis. The other type has wavelength values characteristic of the target material in the tube. The X-rays used in powder diffraction are produced by the ejec-tion of electrons from the K shell of target atoms followed by the transfer of electrons from L or M shells to fill the vacancy. The Kα radiation is produced when L electrons move in to fill the vacancy, and the Kβ radiation is produced when M electrons move in to fill the vacancy.
The X-rays are produced in a vacuum tube. It has a cathode or filament, from which electrons are emitted, and an anode or target, where X-rays are produced. The anode is maintained at high posi-tive potential relative to the cathode, typically 30 to 60 kV, and the X-ray intensity is directly proportional to this potential. The need for stable X-ray intensity means that the stability of the power supply is important. The cathode is typically a tungsten wire through which a current, typi-cally 10 to 25 mA, is passed to heat the wire and assist in emission of electrons. The X-ray intensity is directly proportional to this current. Much heat is produced at the anode, so it is cooled to prevent melting and extend tube life; rotating the anode provides greater intensity of X-rays because it allows operation at higher potentials.
When X-rays pass through a material, some are absorbed and the intensity is thereby reduced. The decrease in intensity is given by:
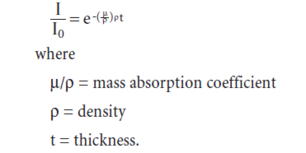
The mass absorption coefficient depends on atomic number (and hence on the wavelength) as shown in Figure 8.2.8. There is a discontinuity at the critical energy at which its own inner shell electron is ejected.
X-rays absorbed in this way produce new radiation, called fluorescent radiation, at some different wavelength, characteristic of material doing absorbing. We use the phenomenon of absorption to shield the operator from unwanted radiation (this is the reason your dentist places a lead apron over your chest when taking X-rays) and to selectively filter radiation for XRD (using material that has high absorption for Kβ and low absorption for Kα) in some instruments.
Detection of X-Rays
So far we have been speaking of X-rays only as waves, but the X-ray detector relies on the particle nature of the radiation. The detector should count every X-ray photon of the characteristic wave-length and not count photons of other wavelengths. The detector should provide proportionality between the detector pulse rate and the X-ray intensity and between the voltage of detector pulse and the energy of the X-ray photon.
Film is a classical X-ray detector. X-rays initiate a photochemical change in a silver bromide emul-sion that produces a deposit of silver grains when the film is developed. The degree of blackening is proportional to the intensity of radiation and the time of exposure.
One type of electronic detector is the gas ionization counter. This counter is filled with some noble gas. When an X-ray photon strikes a gas molecule, the molecule ejects photoelectrons which are accelerated toward the anode where they produce an electronic pulse. The amplified pulse provides a measure of X-ray intensity. These detectors provide good linearity.
Another type of electronic detector is the scintillation counter. This counter contains a crystal that fluoresces visible light (called a phosphor or scintillator) when struck by X-ray photons. A photo-multiplier converts the light to electrical pulses and amplifies the signal. The pulse amplitude is proportional to the energy of the incoming X-ray photon, but the energy discrimination is not as good for scintillation counters as it is for proportional counters.
The third type of electronic detector is the semiconductor counter. The X-ray photon creates an electron hole pair in the solid-state detector (for example lithium-drifted silicon, lithium-drifted germanium, cadmium telluride, or mercuric iodide). The number of pairs is proportional to the energy of the X-ray photon. These electron-hole pairs are attracted to the detector electrode where they produce a pulse whose amplitude is proportional to the number of pairs (hence to the energy of the absorbed photon). This type of detector is common in X-ray fluorescence and scanning electron microscopy but not common in X-ray diffraction.
Some detectors are sensitive to position. As discussed below, the electronic detectors are usually rotated around the specimen, collecting X-ray photons as a function of angle. The position-sensitive detector utilizes a gas proportional detector with a long anode wire. The rate at which the pulse reaches each end of the wire allows calculation of the position where the pulse originated, thereby recording the entire pattern at one time.
Geometry of Diffraction
Powder diffraction may be performed using a camera with film or a diffractometer with an elec-tronic detector. In the camera, the film is usually wrapped in a large circle around the specimen. The X-ray beam strikes the specimen, and the diffracted beam causes film to be exposed. It is necessary to develop the film and to measure the position and intensity of each diffraction peak. In the diffractometer the detector moves around a circle measuring intensity as a function of posi-tion, while the goniometer maintains the proper geometric source – specimen – detector configu-ration for diffraction according to the Bragg equation. Because the diffractometer is more common, it is discussed here in greater detail.
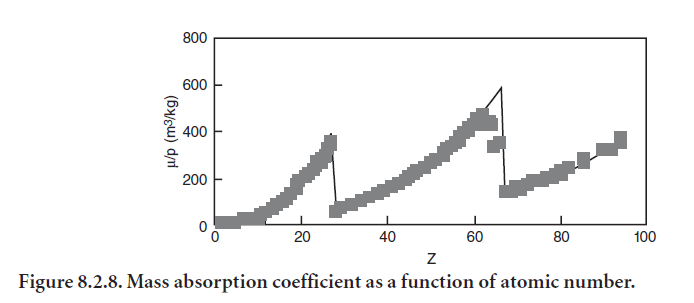
The Bragg-Bentano geometry, shown in Figure 8.2.9, is the most common for commercial diffractometers. The flat specimen rotates at an angle θ and the detector rotates at an angle 2θ with respect to the primary X-ray beam. This angle 2θ is widely used to describe the XRD peak angle. The X-ray tube, specimen, and detector all lie on the focusing circle, whose radius varies with angle, decreasing as 2θ increases from 0° to 180°. In addition the X-ray tube and the detector lie on the goniometer circle, whose center is at the center of the specimen, and the detector rotates around this circle. The specimen rotates about the same axis but at half the angular rate, so the surface of the specimen remains tangen-tial to the focusing circle.
Sollers and slits may be added to reduce divergence and peak asymmetry. Sollers reduce axial divergence, which causes peak asymmetry. Slits reduce angular divergence. The slit may be varied in width to maintain a constant area of irradiation on the specimen. Both typically cause a loss in intensity.
Filters and monochromaters make the radiation more nearly monochromatic. The filter relies on changes in mass absorption coefficient with wavelength, discussed previously. It is not entirely effective, allowing some Kβ radiation, which must be considered when indexing the pattern. The monochromater, which uses a crystal to rediffract the beam, is more effective at removing Kβ radiation.
Maintaining proper instrument alignment is critical for both intensity and peak position. Good laboratory practice includes regular checking of instrument performance (peak position accuracy, peak intensity consistency, presence of tube contamination lines) using a standard material and maintaining control charts that document system performance and indicate when the instrument has changed. The goniometer should be realigned whenever this analysis shows that alignment has been lost. The performance check should include peak position, peak intensity, and separation of partially resolved peaks. Quartz or silicon plates are often provided by manufacturers and are suit-able for this purpose. The National Institute of Standards and Technology (NIST) offers a variety of standard reference materials (SRMs) for powder diffraction; of particular interest is SRM 1976, an instrument sensitivity standard consisting of a sintered corundum plate with certified peak intensities across a wide angular range (25 to 145 °2θ,Cu Kα). Instrumental errors are discussed in Chapters 2 and 3 in Bish and Post (1989).
SPECIMEN PREPARATION
The objectives in specimen preparation are to provide a representative, homogeneous specimen with fine particle size and random crystallographic orientation of individual grains. It is important that a large number of crystallites contribute to each reflection to give reproducible intensity. The surface must be smooth and planar, and the specimen must be infinitely thick with respect to the X-ray beam. The specimen should be free from preferred orientation and other sources of intensity error.
Crystals that are asymmetrical in shape, especially plates or needles, tend to orient themselves nonrandomly. This condition is called preferred orientation, and it increases the intensity of some peaks and reduces the intensity of others. It may cause major errors in quantitative analysis, and in the extreme it may cause difficulties in qualitative analysis. Several procedures reduce preferred orientation (the list increases in complexity and cost): filling the specimen holder from the side or the back, grinding the specimen to a very small grain size (< 5 µm), suspending the specimen in a solid filler material, and suspending the specimen in a liquid and spray drying (producing spheri-cal agglomerates that orient randomly when packed).
Another potential source of intensity error in quantitative analysis is microabsorption. Specimens containing phases with quite different absorption coefficients are likely to show microabsorption effects. Absorption and microabsorption are discussed further in the section on quantitative analy-sis. The effects of microabsorption on peak intensity may be appreciable and are not corrected by using an internal standard. Specimens exhibiting these effects should be ground to a particle size <2 µm to avoid errors.
We have already discussed how extinction causes certain crystal structures to have missing reflec-tions, but there is another type of extinction in which intensity is reduced due to diffraction. For a perfect crystal at the position for diffraction, intensity is reduced slightly by reflection. Reflection produces a beam parallel to, but out of phase with, the primary beam, causing a loss in intensity. For a perfect crystal, the loss at the Bragg position due to extinction plus absorption may be much greater than the loss at a neighboring position due only to absorption. Real crystals are not perfect and only a small number of crystallites are oriented for diffraction at any one beam direction, so the intensity loss due to extinction is much smaller. Errors due to extinction are reduced by grind-ing to a particle size < 5 µm.
For routine qualitative analysis, it is sufficient to grind the specimen to about 45 µm. For repro-ducible intensity measurements, it is important to grind specimens to about 5 µm to reduce effects of preferred orientation and extinction, and to about 2 µm if microabsorption is likely. However, grinding too finely (e.g., < 0.2 µm) produces line broadening, though broadening is minimized by using a liquid grinding medium. According to Stutzman (1996), wet grinding with a Micronizing Mill3 provides a suitable particle size distribution. Other procedures are described in Bish and Post (1989).
Specimens must be homogeneously mixed for quantitative analysis. It is generally better to mix as a suspension in some fluid phase. It is preferable to mix using high shear energy. Wet mixing with a Mixer Mill4 provides uniform and homogeneous mixing.Stutzman (2001) reports that dispersing a concentrated suspension using an ultrasonic probe also provides good mixing.
The specimen should have a smooth and planar surface that is reasonably dense. However, exces-sive packing force enhances preferred orientation. Filling the specimen holder from the back is satisfactory, avoiding preferred orientation for all but the most difficult materials. Rotation of the specimen in its own plane reduces intensity fluctuations and provides more reproducible measure-ments but does not reduce preferred orientation effects. It is also important that the specimen be positioned reproducibly (commensurate with geometry requirements). While automatic specimen changers are convenient, they are less likely to satisfy these requirements.
XRD equipment has a wide variety of configurations and functions to accommodate different specimen sizes and forms. It could be a powder sample, or a single sheet of material, or metal. Powder diffractometry is by far the most used technique to obtain x-ray diffraction data, and is the way in which cement and clinker are analyzed, as well as hydrated paste or mortar, raw materials, cementitious materials and other minerals and rocks related to cement manufacturing, provided they are prepared and ground to a suitable particle size as explained before.
Powders are pressed into a sample holder and a flat surface created that will be exposed to x-rays. XRD equipment such as that shown in Figure 8.2.10 are capable of handling several samples in routine analyses. Other equipment is installed in the process on-line and used to verify quality in production or to detect potential problems with raw materials. Excessive pressure in powder pack-ing may result in preferred orientation as it was described above.
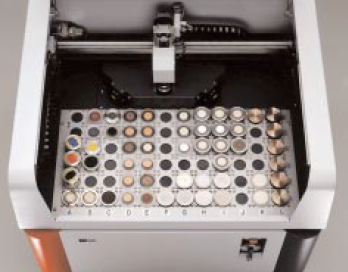
Figure 8.2.10. Sample magazine coupled to XRD diffractometer and x-ray generator (not shown) for XRD analysis. Automated systems allow for several samples to be analyzed by using computer programming.*
Other samples may be available in very small quantities (Figure 8.2.11) for analysis and may require special handling. Sample holders provided with XRD equipment are able to handle this type of samples. For example, few milligrams of a powdered sample can be analyzed by using a special quartz glass, which is specially designed for diffracting no x-rays and only to serve as sample holder. The glass holds the sample and is equally exposed to x-rays, but will not generate any signal and there-fore create any interference in the sample’s XRD pattern.
Samples obtained in very small quantities in fine solid powder state after filtering and drying, as shown in Figure 8.2.12, can always be mounted in the sample holder and later the pattern of a blank filter obtained for subtracting the signal from the sample’s pattern. These procedures are not recommended for quantitative work because peak relative intensity may be seriously affected by factors such as preferred orientation and others. Select scan parameters that are appropriate for the desired analysis. For routine qualitative analysis, use a fast scan rate, a moderate step size, and a short time constant. For careful qualitative work (e.g., deter-mination of lattice parameters), use a slow scan rate,a small step size, a narrow receiving slit, and a short time constant. For quantitative analysis, use a slow scan rate, a small step size, a wide receiving slit, and a long time constant.

Figure 8.2.11. XRD analysis is equally suitable for small-size samples.*

Figure 8.2.12. Samples obtained after filtration and drying for XRD analysis.*
ANALYSIS OF DIFFRACTION DATA
Qualitative Analysis
A common reason to use powder XRD is to determine qualitatively the crystalline phases present in a sample. This type of analysis is well described in standard references on XRD. Modern instru-ments have computer programs for qualitative analysis. The principles of the manual method are described here because they apply to both manual analysis and analysis using computer programs.
As already explained, the pattern for each phase depends on its crystal structure and chemical composition. The pattern for a mixture of phases is a simple combination of patterns of the indi-vidual phases. In qualitative analysis, the pattern is treated simply as a set of peaks, each with a position and intensity. Qualitative XRD analysis compares the pattern to a library of patterns of known materials. The most commonly used library is the Powder Diffraction File (PDF)5.
The PDF includes an index for searching and matching patterns, called the Hanawalt index, in which the most intense peaks of each phase are listed in descending order (by d-spacing). Patterns are grouped based on the position of the strongest peak. Within each group, patterns are assigned to subgroups based on the position of the second strongest peak and listed in order of the position of the strongest line. This sequence is repeated for each of the three strongest peaks, to allow for variation in relative peak intensity.
For manual analysis, the approach begins with a measurement of the position, d-spacing, and intensity of each diffraction peak. The most intense peaks are used to search the index and deter-mine potential matches. Then the entire pattern of each potential match is examined to make a final identification. Once a phase has been identified, its peaks are subtracted from the pattern and the search is begun again with the remaining peaks.
In an automated diffractometer, the computer controls the operation of the instrument, measures the position and intensity of each peak, and performs the qualitative analysis. Peak positions are measured by profile fitting or by derivative. Profile fitting uses some standard function (e.g., Gaussian, Lorentzian, Pearson, Voigt) to determine not only position but also intensity, integrated intensity for quantitative analysis, and line shape for determination of strain, order, or crystallite size. The derivative method takes the first and second derivative of I(q) and uses the minimum in the second derivative (found using a parabolic function) as the peak position. For qualitative analysis, the computer builds a Boolean search tree, searches the database, and retrieves patterns that are potential matches. It then compares (usually with operator assistance) these to the experi-mental pattern in order to identify phases. Thus the automated sequence is very similar to the manual approach.
Regardless of whether qualitative analysis is performed manually or with a computer, some general guidance can be given. It is very useful to have some information about the material, in particular the major chemical constituents. Many potential phases can be ruled out based on such knowl-edge. If you misidentify a phase, your entire analysis may be thrown off because highly disparate phases may have remarkably similar diffraction patterns. And if you misidentify one phase in a mixture, you may be unable to make correct identification of the other phases. Analysis may be especially difficult in mixtures containing many phases or mixtures of phases with similar diffrac-tion patterns. In addition, identification of minor phases may be difficult because often only their stronger peaks are observed. It may be necessary to separate phases in a mixture in order to complete the identification; such separation is commonly used for portland cement, and specific procedures are described later in this chapter.
Quantitative Analysis
In a mixture of phases, the intensity of the pattern for each phase depends directly on the propor-tion of that phase in the mixture. As discussed previously, the intensity also depends on the crystal structure and chemical composition of the phase. The intensity also depends on chemical compo-sition of the other phases in the mixture. Finally, the intensity also depends on the intensity of the X-ray source, details of the instrument (slits, monochromater, detector), and details of the speci-men (i.e., grain size and packing density). XRD is one of the few methods that provides a measure of the amount of each phase in a mixture.
Absorption of radiation by the specimen is a major compounding factor. Without absorption we could just compare intensity of phase in mixture with its intensity in a pure form. As noted previ-ously, materials vary in the degree to which they absorb X-rays. When a material contains both a weak absorber and a strong absorber, the weak absorber is reduced in intensity, and the strong absorber is increased in intensity. The effect may be large; differences in absorption may cause the relative peak intensity to differ considerably from the amount of the phase present (e.g., the rela-tive pattern intensity may be 30% when the amount of the phase is really less than 10% or more than 50%).
At issue here is the mass absorption coefficient µ/ρ and the linear absorption coefficient µ.
For a mixture, the mass absorption coefficient is the sum of the mass absorption coefficient

where
I = intensity
K = constant
x = mass proportion
ρ = density
μ* = mass absorption coefficient
i = specific peak
α = specific phase
r = remaining phases.
The effect of microabsorption was discussed previously. Consider a mixture of α and β with very large grain sizes, such that X-rays going to grains of β must pass only through grains of α.Then the intensity of radiation diffracted by β is reduced by the absorption coefficient of α, not by the average absorption coefficient for the mixture. The individual intensity ratio Iiα/Iis is increased or decreased by a microabsorption factor K. This factor increases when there is a large difference between the absorption coefficient of α and the mixture, and when the particle size is large.
Although it is possible to calculate the linear absorption coefficient for α and r, it is much easier to do an empirical calibration to determine the relationship between XRD intensity and amount of α. Two calibration approaches are common: internal standard and spiking.
In the internal standard approach, a known amount of a selected internal standard is added to each unknown mixture and the ratio of intensity of phase α to intensity of the internal standard is determined. It is necessary to have determined the intensities of α and the internal standard in a series of calibration mixtures using known amounts of each. From the calibration results it is a simple matter to compute the amount of phase α in the mixture. Because the absorption effects are similar for the internal standard and the unknown phase, the relationship between intensity ratio and weight ratio is approximately linear. Errors (e.g., microabsorption, preferred orientation) may cause the relationship to be not precisely linear, and if the mass absorption coefficient of the internal standard is very different than the mass absorption coefficient of the mixture, the relation-ship is not linear. Therefore in the calibration mixtures the amount of the unknown phase should cover the full range anticipated in the unknown samples, and the matrix in the calibration mixtures should be similar in composition to the matrix in the unknown samples. The internal standard calibration process takes considerable time, but it can be used to analyze any number of unknown samples. So this is the preferred approach if you need to analyze many mixtures that are basically similar in composition.
The reference intensity ratio (RIR) is a variant of the internal standard approach that was developed at NIST. The ratio is defined as RIR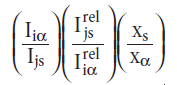
for one peak i in α and one peak j in the internal standard s. The RIR is then a function of α and s but not of i, j, or xs.More importantly, the RIR does not depend on the instrument, at least as a first approximation. Therefore values of RIR are often included with the PDF data. The RIR included in the PDF data is the ratio of the integrated intensity of the strongest line of the phase to the strongest line of corundum (Al2O3) for a 1:1 mixture (by weight) measured using Cu Kα radiation. The RIR values allow a rough estimate of proportion without any calibration.
In the spiking approach, a small known amount of phase α is added to the mixture. From the intensity in the initial mixture and in the spiked mixture, the amount of phase α in the initial mixture can be calculated. Because the amount of addition is small, the absorption effects are neglected. The accuracy is improved if several addition amounts are used. This is the preferred approach if you need to analyze only a few mixtures of that particular composition.
The Rietveld approach, whose application to cement analysis is described later in this chapter, uses a computed pattern for quantitative XRD analysis. The computation is based on crystal structure and phase composition according to the principles discussed here in the section “Diffraction of X-rays by Crystals.” Inputs include the composition and crystal structure of each phase; failure to identify a constituent causes errors in all results. The pattern is refined until it matches the experimental pattern by adjusting the crystal structure of each phase, the proportion of each phase, orientation, extinction, and strain. Because this is a full profile analysis, errors due to extinction and preferred orientation are reduced. The refinements in crystal structure are not as good as the structures determined using single crystal analysis, but they are improving and there continues to be much effort in this area. Most importantly, the method allows quantitative analysis without calibration and users report very good accuracy and precision for highly complicated mixtures (including portland cement). It is especially useful for phases that are difficult to obtain in a pure form for empirical calibration and for mixtures with poorly crystalline components or mixtures with much peak overlap. Many versions of Rietveld code are available, and most are shared at no cost.
Regardless of the approach used, some general guidance on quantitative XRD analysis can be given. It is important to use integrated peak intensity rather than peak height for quantitative analysis (although peak height is sufficient for qualitative analysis). The more peaks you use, the more accurate is your analysis, and fitting the full pattern may be more accurate than using one or more isolated peaks. The main sources of error in quantitative XRD analysis are counting statistics, preferred orientation, microabsorption, and extinction. With careful calibration, you can expect to obtain an absolute error of about 3%, regardless of method used (internal standard, spiking, Rietveld, whole pattern or discrete peaks). It is important not only to estimate precision and accu-racy but also to determine the minimum detection limit, which is typically a few percent.
APPLICATION OF XRD IN CEMENT MANUFACTURING
The following sections are dedicated to the application of XRD technique citing examples of commonly encountered material, and operational, product, and environment related problems in cement manufacturing. The major areas discussed are as follows:
• Raw materials
• Alternative materials and fuel
• Material processing
• Product quality
• Cement analysis
• Operational troubleshooting
The XRD characterization of raw materials is presented first, providing information about the major mineralogical constituents in limestone, clay, and other raw materials, and citing common problems during feed preparation and their consequences on pyroprocessing. Characterization of alternative materials is included in recognition of their growing use in modern cement manufac-ture. Finally, product quality and troubleshooting are covered from a cement manufacturing perspective and to show how XRD provides a basic, yet reliable, tool in diagnosing cement manu-facturing problems.
RAW MATERIALS
Limestone
Limestone is the main raw material used in cement manufacturing. It comprises from 70% to 95% of the raw meal fed to the kiln. Calcite (CaCO3) is normally the most abundant phase in limestone; its strongest diffraction peak is produced at 29.4 °2θ with Cu Kα radiation6. Quartz, feldspars, and clay minerals are normally present as minor contaminants in limestone deposits. Dolomite is also found in small amounts in some limestones, as discussed later in this section. Figure 8.2.13 shows a typical XRD pattern of limestone.
 4
4
Quartz in limestone. One major problem in cement manufacturing is achieving proper grind-ing and fineness of the material that is to enter the kiln. The presence of coarse quartz in limestone can have an impact on both the parameters. Assessment of coarse quartz in raw feed can effectively be made by XRD in conjunction with acid treatment of the sample and particle separation. The raw feed is treated with dilute hydrochloric acid until all carbonates have been decomposed. The residue is then filtered, dried, and analyzed by XRD. The XRD pattern showing quartz peaks gives an estimation of insoluble quartz in the feed. Figure 8.2.14 shows the XRD pattern of a raw feed prepared by this procedure. Reference pattern lines superimposed on the sample’s pattern indicate the position and intensity for major quartz peaks.

Additionally, if the insoluble residue is sieved through a No. 325 sieve, and the XRD pattern of the portion retained on the sieve is obtained, abundance of quartz coarser than 45 µm can be esti-mated from this fraction. Figure 8.2.15 shows the XRD pattern of a coarse fraction obtained after acid treatment of a cement raw feed. It is apparent that this kiln feed sample has a relatively high amount of coarse quartz.
Because quartz is harder to grind than other materials in the raw feed and is harder to burn, it is likely that cement produced with this kiln feed will contain belite clusters formed during clinkering process. Raw feed containing coarse quartz will require more grinding energy to produce a quality clinker.
Clay
Clay materials from quarries used in cement manufacturing normally occur together with feldspars, quartz, and carbonates (calcite or dolomite). The XRD is an essential tool, aided by optical microscopy and chemical analysis, to characterize and identify clay components in cement raw materials. Clay minerals have a layered crystal structure and often occur as thin sheets paralallel to these crystal layers. Clays are often poorly crystalline and often occur as very small grains. For these reasons, their basal peak (from the crystal layer) is often the only recognizable peak and may be quite broad. The d-spac-ing of the basal peak is usually quite broad, a feature that is very helpful for their identification in the presence of minerals like quartz, feldspars, or carbonates. For instance, a diffraction peak at 12.3 °2θ identifies kaolinite, usually indicative of kaolin clay present in the overburden of limestone quarries. Another clay commonly found is illite. An example of the XRD pattern on clay minerals identified in a clay source for cement manufacturing is shown in Figure 8.2.16.

Dolomitic Limestones
Dolomite (CaMg(CO3)2) has limited use in cement manufacturing because the clinker resulting from its use would be excessively high in free MgO or periclase upon clinker cooling. Potential problems may arise with these cements because of their excessive expansion. However, some cement producers have dealt with high MgO clinkers by adjusting the raw mix chemistry to produce a clinker with a lower MgO/Fe2O3 ratio. As a rule of thumb, when this ratio is lower, more MgO can be tolerated without failing the autoclave expansion test. At certain cement-making locations the only limestone readily available may contain appreciable dolomite, and in such cases, careful char-acterization of the limestone is required. In the example shown in Figure 8.2.17, the limestone contains a rather high proportion of dolomite, whose XRD reference lines are shown in the pattern.
A cement or clinker suspected of containing high MgO should be analyzed by XRD. Chemical analysis is also desirable. Clinkers or cements high in MgO may contain as much as 8% or as little as 3.5% periclase by mass. Figure 8.2.18 shows a clinker sample with an unusual amount of peri-clase, readily identified by the diffraction line at 42.9 °2θ.

Gypsum Rock
In the sense that gypsum is added to clinker during intergrinding in the finish mill, it is considered a raw material in cement manufacturing. Its purpose is to control setting when the cement starts to hydrate. Gypsum is generally secured from naturally occuring deposits in the earth crust. When gypsum deposits are not readily available, it is common to use alternative sources of gypsum, such as “scrubber” gypsum, a byproduct of flue gas desulfurization. Such alternative sources of gypsum are covered in the next section.
In natural gypsum deposits, it is most useful to scan the source for naturally occurring anhydrite (CaSO4) or anhydrous calcium sulfate. Since this form of calcium sulfate is not as readily soluble in water as is gypsum (CaSO4•2H2O), anhydrite can fail to control concrete setting appropriately. In addition, anhydrite is much harder than gypsum and will not be ground as fine during finish grinding; this will also reduce its rate of solubility. For these reasons, sources of gypsum containing high amounts of anhydrite are usually avoided. However, if the finish mill temperature is very high, dehydration of gypsum might produce too much hemihydrate (CaSO4• 1⁄2H2O), thereby causing false set. In such a case, it may be desirable to add some of the needed calcium sulfate as anhydrite. XRD provides a quick method to detect anhydrite together with coexisting gypsum, hemihydrate, and minor contamination such as calcite and quartz. Figure 8.2.19 shows an XRD pattern of a gypsum source.
Naturally occurring anhydrite, sometimes referred to as “insoluble” anhydrite, differs from “solu-ble” anhydrite in that they have different crystalline arrangements and therefore have slightly different solubility in water. “Soluble” anhydrite can result, for instance when gypsum is exposed to temperatures above around 200°C and loses its chemically bound water. This compound is not easily distinguished from plaster by XRD in gypsum sources but is rapidly soluble and usually causes no interference in controlling concrete setting.

ALTERNATIVE RAW MATERIALS
Bauxite
Bauxite may be used in cement manufacturing in cases where lime and/or silica sources do not provide enough Al2O3 for the desired clinker formulation. Bauxite’s mineralogical composition also includes different polymorphs of aluminum oxide and hydroxide, such as gibbsite, norstran-dite, and bayerite, which are readily identifiable by XRD. Bauxite may also contain hematite and magnetite, which incorporate iron into the clinker. Corundum (Al2O3), is also readily identifiable. It is a very hard mineral and its identification is a decisive factor for raw feed grindability consider-ations. Figure 8.2.20 shows the XRD pattern of a bauxite sample considered as an alternative source of alumina for cement making. The reference lines shown in Figure 8.2.8 identify gibbsite, Al(OH)3, as the main phase in the sample.
Figure 8.2.21 shows another example of a bauxite source considered for cement making. This particular sample is primarily composed of a mixture of gibbsite (reference lines shown) and hematite (peaks at 33.1X, 35.67, 24.13 °2θ). It also contains anatase (TiO2), aluminum oxide hydroxide, or boehmite (AlO(OH)), and traces of calcite, quartz, and kaolinite.


Blast Furnace Slag
It is often desirable with slag to determine amorphous vs. crystalline composition. The main chemical constituents of blast furnace slag are calcia, silica, alumina, and magnesia. Table 8.2.1 gives a range of slag composition from several sources.

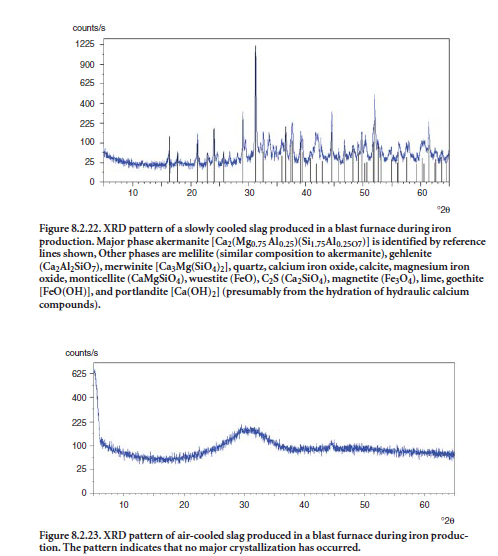
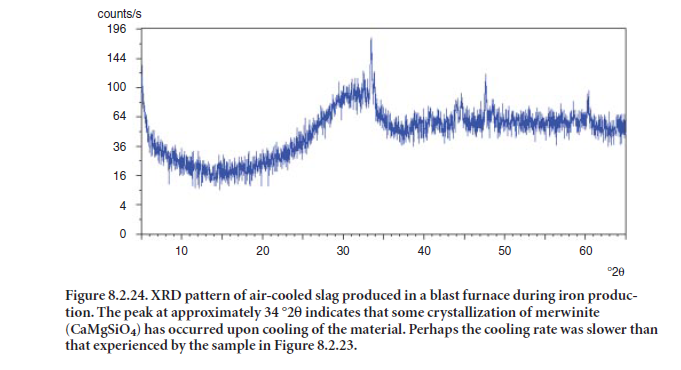
When molten slag is cooled slowly, crystallization occurs, and the ground slag product is less reactive for intergrinding/blending with clinker to make cement or for direct use in the concrete mix. If the molten slag is cooled rapidly, “glassy” material is obtained and the resulting slag exhibits hydraulic properties suitable for use in cement or concrete. Figure 8.2.22 shows the XRD pattern of a slag with several crystalline phases and a very low glass content, as indicated by the absence of a halo or “hump” around 32 °2θ. Figures 8.2.23 and 8.2.24 show XRD patterns of slag that are rich in glass (shown by the “halo” at 32 °2θ); these slags are suitable for ntergrinding/ blending with clinker or directly mixing with concrete.Merwinite (CaMgSiO4) is a common crystalline phase in one slag, as shown in Figure 8.2.24 .
Synthetic Gypsum
As discussed previously, the gypsum component of portland cement is incorporated by intergrind-ing with clinker in the finish mill. Gypsum is usually sourced in cement plants from natural deposits, but when no acceptable source of gypsum is available, alternative sources of gypsum may be viable. Many plants today use alternative sources of gypsum, sometimes referred to as “synthetic” gypsum. “Scrubber” gypsum from power plants is a typical example. Other common sources include byproducts of acid production, like phosphoric acid (“phosphogypsum”), citric acid (“citrogypsum”), or hydrofluoric acid (“fluorogypsum”). Recycled gypsum molds and gypsum wallboards are other examples of synthetic gypsum.
Synthetic gypsums must be characterized for composition and properties prior to their introduc-tion to the finish mill. Figures 8.2.25 and 8.2.26 show XRD patterns of two synthetic gypsums. In Figure 8.2.25, XRD reveals crystalline gypsum (CaSO4•2H2O) with little or no contamination by quartz, calcite, or other forms of calcium sulfate, confirming that the material is suitable for use in cement production.
Figure 8.2.26 shows a sample of synthetic gypsum with a lower degree of purity. Here, the XRD pattern reveals the presence of nondesired contaminants such as calcium sulfite hemihydrate (CaSO3·H2O) and calcite. Calcium sulfite (including the hemihydrate mineral hannebachite) interferes with set regulation of cement.

Fly Ash
Utilization of fly ash in cement production is widespread, including incorporation as a component of raw feed in cement manufacturing. While the chemical requirements fix the amount of fly ash that can be incorporated into a cement raw feed, the mineralogical properties as assessed by XRD will help determine how suitable a particular fly ash is.
An example of fly ash incorporated into cement raw feed includes a recent demonstration at a cement manufacturing plant that used high-carbon fly ash (LOI ~ 12%) for its additional fuel value (Bhatty and others, 2001). The identification of crystalline and “glassy” phases by XRD was helpful in assessing how easily the kiln feed containing fly ash could be combined with lime at the kiln’s high temperatures. The burning of kiln feed is enhanced by “glassy” fly ashes because they are more reactive with lime than crystalline ashes.
When fly ash is intended to be used as a pozzolanic mineral addition (whether interground/blended in cement or added to concrete), determination of glass and crystalline components is very important. The value of fly ash as a mineral addition is strongly based on its pozzolanicity, i.e. its ability to react with calcium hydroxide to produce calcium silicate hydrate.
For the reasons mentioned above, XRD represents an invaluable technique to characterize fly ash for its glass vs. crystalline composition and therefore to identify potential applications. Fly ash with a higher calcium content, often found in Class C fly ash, results from burning subbituminous or lignite coals. Its crystalline phases include gehlenite, quartz, periclase, anhydrite, ferrite spinel, and merwinite. In some instances, tricalcium aluminate may also be present, which can cause imbal-ance in cement setting-control reactions. Figure 8.2.27 shows an example of a Class C fly ash.
Low-calcium fly ashes, often referred to as Class F fly ashes, result from burning bituminous or anthracite coals. Common phases detected in these ashes include quartz, mullite, hematite, magnetite, anhydrite, and potassium sulfate (Bye, 1999). Figure 8.2.28 shows an example of fly ash classified as Class F. As can be seen in Figures 8.2.27 and 8.2.28, the glass halo is identified with a maximum at around 30 °2θ for Class C, and around 25 °2θ for Class F. This characteristic is desir-able for its pozzolanic potential when used as a mineral addition.

FUELS AND ALTERNATIVE FUELS
Coal Characterization
The principal solid fuel used in cement manufacture is coal. In addition to clay minerals, common impurities in coal are carbonates, iron sulfides such as pyrite (FeS2) and other sulfides, chlorides, and quartz (Bye, 1999). XRD is a useful tool for detecting these compounds. Sulfides and chlorides can cause a variety of problems when coal is burned in the kiln or in the calciner. The use of coals (and fuels in general) is limited by the total sulfur content, and some sulfur is in the form of crys-talline sulfides, XRD will be a useful tool for detecting these compounds. Chlorides also may be present in crystalline structures like sylvite or halite that can easily be detected by XRD.
Pyrite is found in coal as a common impurity and in some limestone deposits as well. Its XRD peaks are located at 33.0X, 56.27, 37.15, and 40.74 °2θ.
PRODUCT QUALITY
Clinker Reaction/Burnability
The single most important parameter in monitoring the process of clinker formation is the amount of free lime present in the clinker. A raw mix with a lime saturation factor (LSF) between 0.88 and 0.97 and proper temperature and burning conditions in the kiln (Peray, 1986) should not have a high amount of free lime as detected by XRD (detection limit ~ 1 wt. %). Lime (CaO) has XRD peaks at 37.4X, 54.08, and 32.35 °2θ,with the advantage that its highest peaks will stand apart from the rest of the other clinker and cement phases showing no overlap. Therefore, it is easy to identify even in small quantities.
In cement manufacturing XRD has been well established as a primary tool of process control. The XRD analyzers are installed on-line to monitor free lime after the kiln stage using single-channel detector units. Modern cement plants are equipped with X-ray detectors capable of scanning an entire angle range (e.g., 60 °2θ) in a matter of minutes. Consequently, XRD is extremely useful in fine-tuning the formulation of raw mix by monitoring the free-lime content as a function of temperature and residence time during pyroprocessing. Figure 8.2.29 shows how the formulation of a raw mix is developed and enhanced (mixes A, B, and C) by burning correct proportions of materials and fine-tuning the temperature and time conditions to obtain a desired clinker of lower free lime content.

Clinker Characterization
XRD has traditionally found varied applications in clinker characterization both in 1) the qualita-tive identification of major clinker phases, and 2) the semiquantitative analysis of the phases based on relative comparison of peak heights or peak areas with those of internal standards added in known amounts. The major phases in question are alite (C3S), belite (C2S), aluminate (C3A), and aluminoferrite (C4AF). Other compounds of interest such as free lime, alkali aluminates, Alkali sulfates, calcium langbeinite, periclase, and syngenite can also be detected for complete characteri-zation of clinker.
Rietveld Method
Recent advances in computer software now allow the use of mathematical algorithms that make use of crystallographic parameters to model the diffraction pattern of crystal structures (Möler, 1998). It is possible then to calculate the XRD patterns of given crystal structures and compare and fit them to a sample’s XRD pattern containing mixtures of these crystalline structures in unknown quantities, and determine the amount of each phase present. This calculation algorithm was proposed and used by Rietveld in the 1960’s, but recently its use has achieved popularity in XRD analysis, with the help of computer software programs in practical application.
The Rietveld method offers considerable advantages over more time-consuming clinker microscopy or XRD analysis based on empirical calibrations, Direct phase analysis offers considerable advantage over the Bogue compound calculations (discussed in Chapter 8.1), whose phase estimations may not produce accurate or reliable results in many cases. However, the nature and number of phases in clinker present fairly complicated XRD patterns. Figure 8.2.30 shows the XRD pattern of clinker where phase overlapping indicates a complex analysis.

Once the crystalline phases have been identified and established, the Rietveld algorithm can be used to calculate their diffraction patterns based on their crystal structures. Combinations of calculated diffraction patterns are compared to the sample’s pattern to determine the best fit. Once the crystalline phases have been identified, the crystallographic parameters are provided to the program for mathematical calculation of each XRD pattern. Most application programs are designed to interface with modules or databases that contain crystallographic data. Crystal param-eters may be optimized so as to improve the fit. Figure 8.2.31 shows a program screen displaying several items in different windows, allowing changing parameter values and iterating to obtain a better fit.
When using the Rietveld method, it is highly desirable for the user to become aware of the software features and potential, since the algorithm for crystal structure refinement offers multiple options that may change the analysis results considerably.

Selective Dissolution and Phase Separation
As already mentioned, cement and clinker XRD patterns are a complicated mixture of phases whose XRD diffraction peaks often substantially overlap. In addition, weak peaks are often obtained from minor phases, like alkali aluminates or alkali sulfates. Physical separation of the phases and subse-quent XRD analysis of individual portions is useful when there are doubts about the proper identi-fication of phases. Selective dissolution techniques offer the possibility of individually analyzing different XRD patterns. In addition for allowing better identification, obtaining concentrated signals from all phases present will enhance the quantification results by the Rietveld method.
Two extractions solutions are commonly used in phase separation for cement analysis: salicylic acid in methanol and aqueous KOH-sugar.
Salicylic acid in methanol extraction (SAMX). This extraction removes the calcium sili-cates and any free lime and facilitates examination of the remaining phases. The clinker (or cement) is added to the extraction solution (20-g salicylic acid in 300-ml methanol for 5-g sample), and the suspension is stirred for 2 hours, then filtered to obtain the residue. This is a remarkably clean separation; no calcium silicates remain and no interstitial phases are extracted, so it can be performed quantitatively. However, any water in the methanol allows hydration of certain phases and dissolution of highly water-soluble phases such as alkali sulfates (Struble, 1985). The extraction is also useful for hydrated cement, and the hydrated phases are generally soluble.
KOH-sugar extraction. This extraction removes the aluminate, ferrite, and sulfate phases, which together comprise about 20% of a typical clinker (or cement), and leaves the calcium silicates and periclase. It greatly facilitates identification of belite crystal polymorphs. The cement or clinker is added to the extraction solution at 95°C (30g KOH and 30g sucrose in 300ml water for 9g sample), the suspension is stirred for 1 minute while maintaining the temperature at 95°C, then filtered to obtain the residue8.
The principal caveat to the use of selective dissolution technique is to ensure that the separation of phases is quantitative. Figure 8.2.32 shows the original XRD pattern for a clinker sample; Figure 8.2.33 shows the residue after treatment of the clinker sample with a solution of salicylic acid and methanol to selectively dissolve the silicate phases and lime. The residue represents 19.7 % by wt. of the original clinker sample. In this way, a separate analysis can be made of the two groups of phases, their crystallographic parameters input to the Rietveld analysis, and a better fit obtained.
Quantification of the phases using selective dissolution should provide a more exact and reliable result, despite the added labor for physical separation of phases. This alternative is of special interest for analysis of cement because of the presence of gypsum and possible inherent contaminants like quartz and calcite in gypsum rock.
Sulfate Forms in Clinker
When gypsum is added to clinker in the finish mill to make cement, the heat generated in the mill by different mechanisms (e.g., friction of the steel balls, hot clinker, etc.) can cause gypsum dehydration, and formation of calcium sulfate hemihydrate (Ca2SO4• 1⁄2H2O) (also known as plaster-of-paris).


Also, natural sources of gypsum may contain relatively high amounts of anhydrite (Ca2SO4,with no chemically-bound water), as previously mentioned. In addition, gypsum dehydration may go beyond hemihydrate formation and, form “soluble” anhydrite (γ-CaSO4) which rehydrates readily.
Where cement exhibits an unusual balance between different forms of calcium sulfate, their vari-able solubilities affect the set regulation of cement. As a simple rule of thumb, for normal cement composition, dehydration of half the gypsum to hemihydrate is close to optimum.
XRD is routinely used to characterize different form of sulfates in cement. Peaks for gypsum, hemihydrate, and anhydrite are all readily distinguishable in the cement XRD pattern shown in Figure 8.2.34. A gypsum diffraction peak at 11.7 °2θ is easily identifiable because it does not over-lap with any other clinker phases. A strong peak for hemihydrate appears at 14.9 °2θ.The strongest anhydrite peak is at 25.4 °2θ.
ANALYSIS OF CEMENT
Portland cement is a complicated mixture of many phases, and XRD allows one to determine directly what phases are present and their relative proportions. The performance of portland cement is generally controlled by the amount of each phase rather than by the chemical composi-tion, so XRD analysis is particularly useful in predicting cement performance. XRD analysis is useful for both anhydrous and hydrated cements.
Anhydrous Cement
The phases in portland cement and clinker have been described in detail by Taylor (1997) and summarized by Stutzman (1996). The phases and their stronger XRD peaks are listed in Appendix A.

A. The principal phases are alite and belite (C3S and C2S), which together comprise about 75% (by mass) of a typical cement or clinker, and aluminate and ferrite, (C3A and C4AF), which together comprise about 15% – 20%. Minor phases include periclase (M), alkali sulfates (arcanite, KÆ, calcium langbeinite, KC2Æ3,or aphthitalite, K3NÆ4), calcium sulfate (CÆ), and free lime (C), which together may comprise about 5%. Cement typically contains, in addition to clinker, one or more forms of calcium sulfate (gypsum, CÆH2,hemihydrate,CÆH0.5,or anhydrite, CÆ), which together typically comprise about 5%. Occasionally cements contain a small amount of quartz (SiO2), calcite (CaCO3), or other impurity phases. Detection of these minor phases often requires selective dissolution and phase separation (discussed later in this chapter). Occasionally cements contain hydrated lime (CH), syngenite (KCÆ2H), or other hydrated phases.
Figure 8.2.35a shows an XRD pattern for anhydrous cement. The pattern is quite complex and there is considerable peak overlap, especially for the calcium silicate phases. As a consequence, it is very difficult to identify minor phases (e.g., those present at levels below a few percent). Removing some phases using chemical extractions, as described and discussed earlier, simplifies the analysis considerably.
A salicylic acid residue is shown in Figure 8.2.35b, and a KOH-sugar residue is shown in Figure 8.2.35c. As can be seen, extraction removes many overlapping peaks and makes it possible to isolate not only the major peaks but also to detect the minor phases or trace phases present in cement.
There is considerable interest in quantitative analysis of portland cement phases. Procedures for analysis of aluminate, ferrite, and periclase are currently described in the ASTM Standard Test Method for Determination of the Proportion of Phases in Portland Cement and Portland-Cement

Clinker Using X-Ray Powder Diffraction Analysis (C1365-98). The approach used in the develop-ment of this standard was described by Struble (1991). Work continues in ASTM to add procedures for determination of calcium silicates, free lime, and calcium sulfate phases. Once such standard procedures have been approved, it is likely that cement specifications will be revised to utilize phase proportions that are directly determined by XRD rather than calculated from the chemical composition using the Bogue equations.
Quantitative XRD analysis of cement is difficult and time consuming, so only a few industrial labo-ratories do the analysis routinely. As discussed earlier, the Rietveld approach is particularly appeal-ing because it does not require empirical calibrations, and Stutzman (2001b) has recently used this approach to analyze a set of clinkers of known phase proportion that is available from NIST.
Hydrated Portland Cement
Analysis of hydrated cement phases by XRD is especially difficult because the principal hydration product, C-S-H, is not well crystalline. XRD gives much information concerning the crystalline hydrated phases (e.g., CH, ettringite, and calcium monosulfoaluminate hydrate) and the unreacted cement phases, but gives little information concerning the poorly crystalline calcium silicate hydrate phase (C-S-H). To further complicate the analysis, the hydrated phases often show preferred orientation.
Calcium hydroxide (CH) is a crystalline phase whose XRD pattern is easily recognizable. Calcium carbonate may exist in several crystalline polymorphs, which can be differentiated by XRD. The two calcium sulfoaluminate hydrates, ettringite or AFt (C3A• 3CÆ •H32) and calcium monosulfoa-luminate hydrate or AFm (C3A•CÆ •H12) are identified if present in sufficient quantity. The poorly crystalline C–S–H that forms under normal ambient temperature and pressure conditions shows only a single broad XRD peak. Taylor (1997) provided the following general description of XRD changes during hydration of cement at room temperature: 1) calcium sulfate peaks disappear rapidly, generally by 24 hours; 2) clinker phases disappear more slowly, each at a different rate; alite and aluminate more quickly (each 50% reacted in about 2 days), and belite and ferrite more slowly (each 50% reacted in about a month); 3) calcium hydroxide peaks appear within a few hours, and by a few days they dominate the XRD pattern; 4) a diffuse broad peak for C-S-H is generally observed after longer hydration times; and 5) AFt and AFm may be observed depending on the composition of the cement.
OPERATIONAL TROUBLESHOOTING
Degree of Calcination
Calcination of kiln feed denotes conversion of carbonates (derived from limestone in the raw mix) to lime, as per the following reaction:
CaCO3 → CaO (lime)+ CO2
In a long kiln, calcination gradually occurs as the raw feed travels counter current to the hot gases in the kiln, whereas in a short kiln, calcination occurs as the material travels down through the preheater against hot incoming gases. A calcined kiln feed requires less heat energy during the clinkering reaction in the kiln.
The example in Figure 8.2.36 shows XRD patterns of kiln feed as it passes through a 4-stage preheater. Conversion of carbonates (from both calcite and dolomite in the raw feed) to lime was monitored to detect changes attributed to calcination. As is evident by the XRD patterns in Figure 8.2.36, carbonates present in the kiln feed show a decrease in their peak height as they pass through preheater cyclones of increasing temperature (stages 1 through 4), and are heated to a temperature at which calcination takes place and carbon dioxide is generated. As a result, an increase in lime peak height is observed by the time the material reaches stage 4 right before entering the kiln. Silica (quartz) remains essentially unreacted in this zone.

Buildups, Ring Formations, and Blockages
Common problems in cement kiln operations include blockages of walls or ducts in auxiliary equipment in the pyroprocessing units, buildups in preheater or precalciner stages, dust collectors, induced-draft (ID) fan blades, etc., and even the inside of rotary kiln where the buildup of material causes ring formation. These phenomena are closely related to temperature, melting points, and volatility of chemical species, and depend upon several other factors such as moisture content and chemical concentrations of the flue gas.
Figure 8.2.37 shows an example of buildup material collected from blades of the main ID fan at the feed end of a preheater tower. Sylvite (KCl) was found to be one of the main phases in the buildup material, presumably forming from the reaction of volatilized acid mist of HCl and potassium salts in the flue gas, later condensed in solid phase when lower temperatures are encountered. Anhydrite (CaSO4) was probably formed from reaction of sulfur oxides with lime or limestone.
The XRD pattern shown in Figure 8.2.38 shows a sample of ring formed inside a cement kiln. A major component in the ring was identified as ternesite, Ca5(SiO4)2SO4 (otherwise often termed sulfospurrite), suggesting that the buildup was caused by a high enough concentration of SO2 in the flue gas to react with calcium silicates; langbeinite and anhydrite were also present in the ring. Blockages cause an increased pressure drop or other related problems

The compound typically found in buildup or blockage materials is spurrite, Ca5(SiO4)2CO3.The main XRD peaks for spurrite are at 33.1X, 34.07, and 29.56.5 2θ degrees. Carbon dioxide in the flue gas may suffice to react with calcium silicates to form spurrite. Spurrite formation is especiallyfavorable in the presence of illite clay or high levels of chloride. Typical buildup materials are given in Table 8.2.2. Usually these types of problems are observed in the kiln, preheater tower, dust collector, and other process equipment where operating temperatures, chemical composition, and sometimes moisture may serve as precursors to form buildups.

Cement Kiln Dust (CKD) Reuse
Cement kiln dust (CKD) has traditionally been regarded as a byproduct material from cement production. It has limited application for recycling as partial replacement of kiln feed and other reuse applications. Bhatty (1995) reviewed several reports citing typical CKD compositions and recycling applications of CKD in cement kiln feed. To properly characterize cement kiln dust, the chemical composition must be known; the alkali content is normally a limiting factor for its reuse. Carbonate (calcite or dolomite) and free lime content of CKD are important considerations for applications such as recycling in cement kiln feed and for soil stabilization. Because of the nature of its origin, the alkali content of CKD is often very high, but highly variable in composition depending on the type of process and raw materials used. A survey by the U.S. Environmental Protection Agency (USEPA, 1993) reported CKD alkali contents ranging from 0.2% to 9.7% for K2O and from 0.7% to 1.2% for Na2O, often too high for use in dry process kilns. Sulfate content is also a factor that limits its reuse in cement making.
Figure 8.2.39 shows the XRD pattern of a CKD sample. Calcite is the main phase, and the dust is also relatively high in alkali sulfate (aphthitalite). Other alkali sulfates usually include calcium lang-beinite and arcanite. XRD provides an assessment of CKD reuse potential in different applications.
Material Conveying
XRD is also a helpful analytical tool to determine the cause of certain disruptive malfunctions in cement manufacturing. For instance, unexpectedly high temperatures of hot clinker in the cooler can cause the plant to disrupt production and may require exclusive maintenance before the kiln can resume production. Figure 8.2.40 shows an XRD pattern of a dark colored deposit from a clinker cooler grate.

The pattern identifies oxides of heavy metals such as chromium, nickel, vanadium, lead, iron, and titanium, as well as aluminum-manganese alloy. This explained that the clinker was much hotter than the normal clinker temperature in the cooler, causing sections of the grate to possibly melt and form a dark color deposit causing excessive wear and tear.
Detached Plume Emissions
Gaseous chemical species not captured by air pollution control devices can often travel through the stack of the cement plant and be emitted in the form of detached plumes. The generic name “detached plume” for this type of emission is given because these chemical species appear like particulate matter separated from the stack and become visible in the form of a cloud or plume with varying opacity, sometimes with appreciable odor.
If the formation of detached plumes could be overly simplified, it would be reasonable to assume that compounds present in the flue gas (such as ammonia, nitrogen oxides, sulfur dioxide, hydrochloric acid, water vapor), and other solid airborne particulate matter (like alkali sulfates, hydroxides, or chlorides) react to produce ammonium chloride or sulfates, calcium sulfates, alkali chlorides, and condensates.
XRD analysis has allowed identification of the solid crystalline compounds in samples taken from a stack when a detached plume was visible. The sample was collected on a filter paper which was then mounted on an aluminum sample holder and analyzed directly using XRD. Figure 8.2.41 shows the XRD pattern obtained, along with the pattern of the filter paper alone.
The major diffraction peaks in the detached plume belong to ammonium chloride (NH4Cl) and calcium magnesium carbonate (CaMg(CO3)2). Formation of NH4Cl can be attributed to postu-lated reactions involving NO2,HCl (mist), NH3 (gas), and H2O to occur in the formation of ammonium chloride (NH4Cl). Other products commonly found to form detached plumes include ammonium sulfate or sulfite, which can also precipitate as crystalline solid phases from the flue gas. Depending on the composition of the particulate matter, the particular mechanism of forma-tion of a plume may sometimes be elucidated in a relatively straightforward way with the help of XRD and other analytical techniques (including odor).
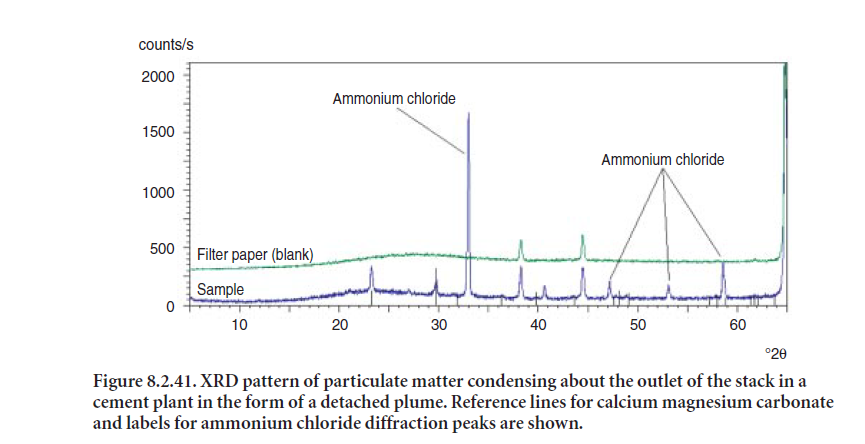
Cement Weathering
When cement is not isolated from moisture or water during storage and handling, hydration of port-land cement may occur. Some cement plants store clinker open to the atmosphere, exposing clinker minerals to water. Some extent of hydration will then occur, depending on moisture/ temperature conditions and length of storage. This generally is a slow process commonly referred to as “weather-ing.” The hydration of portland cement or clinker and its subsequent reaction with carbon dioxide from air, referred to as carbonation, can be visualized by the following reactions:
Hydration
Calcium silicate + H2O (moisture in air) → C-S-H gel + Ca(OH)2
Carbonation
Ca(OH)2 + CO2 (carbon dioxide in air) → CaCO3 + H2O
This process is called prehydration because it occurs prior to the hydration in concrete. Serious consequences of cement prehydration include lower concrete compressive strength and longer setting times.
When prehydration of cement is suspected, XRD analysis helps identify the problem, because the presence of significant levels of portlandite, Ca(OH)2, and calcite, CaCO3, is not expected in ordi-nary portland cement. Figure 8.2.42 shows the XRD pattern of a prehydrated cement sample. The major diffraction lines for portlandite are at 34.0 °2θ, and 18.0 °2θ.
Figure 8.2.43 shows the same prehydrated cement sample shown in Figure 8.2.42, but with refer-ence lines for calcite indicated, including its main diffraction peak at 29.4 °2θ.
Generally during finish milling where water is sprayed for cooling, there may be prehydration problems occasionally when water and temperature are not properly controlled. A comparison of XRD patterns of input clinker and output cement will indicate where such control needs to be tightened.

SUMMARY
X-rays are diffracted by crystals as a direct result of the wave properties of the X-rays and the periodic arrangement of atoms in the crystals. The diffraction pattern can be analyzed to determine what crystalline phases are present, how much of each phase is present, and details of the crystal structure of each phase. X-ray instruments are designed to provide routine qualitative and quanti-tative analysis of powdered samples using diffraction. XRD has been particularly useful in analysis of portland cement and related materials, helped by chemical extractions that selectively remove some phases and concentrate the remaining phases. For qualitative analysis it is sufficient that the powder be ground to about 45 µm, but for quantitative analysis it is important to grind the speci-men to about 5 µm. Computer programs have been developed to carry out qualitative and quanti-tative analysis, but it is important to understand the principles of each type of analysis in order to gain useful information. There is considerable interest in quantitative analysis of portland cement phases. The Rietveld approach is particularly appealing in analyzing clinkers and cements because it does not require empirical calibrations. XRD has the capacity for providing both qualitative and quantitative characterization of materials encountered in cement manufacturing including the raw materials, kiln feed, clinker, cement, CKD, and those involved in operational troubleshooting. Major phases and stronger peaks pertaining to such materials are listed in Appendix A.
ACKNOWLEDGEMENTS
This chapter benefited considerably from numerous discussions and critical review by Paul Stutzman at NIST, and Greg Miller and Fulvio Tang at Construction Technology Laboratories, Inc., Skokie, Illinois 60077. Some XRD data were provided by John Bukowski of University of Illinois at Urbana-Champaign.


REFERENCES
Allen, S., and Thomas, E., The Structure of Materials, (John Wiley & Sons, 1999).
Bhatty, J .I., Alternative Uses of Cement Kiln Dust, Portland Cement Association, Skokie Illinois, USA, RP 327, 1995.
Bhatty, J .I.; Gajda J.; and Miller F. M., “Use of High-Carbon Fly Ash in Cement Manufacture,” Cement Americas, pages 32-34, May/June 2001.
Bish, D. L., and Post, J. E. (eds.), Modern Powder Diffraction, Mineralogical Society of America, 1989.
Bye, G. C., Portland Cement, 2nd Edition, Thomas Telford, 1999.
Cullity, B. D., and Stock, S. R., Elements of X-Ray Diffraction, 3rd ed. (Prentice Hall, 2001).
Klug, H. P., and Alexander, L. E., X-Ray Diffraction Procedures for Polycrystalline and Amorphous Materials, Wiley-Interscience, 1974.
McKie, D., and McKie, C., Essentials of Crystallography, Oxford, 1986.
Möler, H., “Automatishe Profilentfaltung nach Rietveld zur Standarlosen Quantitativen Phasenanalyse,” Zement, Kalk, Gyps International, Vol. 51, No. 1, 1998, pages 40-50.
Peray K. E., The Rotary Cement Kiln, 2nd. Edition, Chemical Publishing Co. Inc., New York, 1986.
Roode-Gutzmer, Q., and Ballim, Y., “Phase Compositrion and Quantitative X-Ray Powder Diffraction Analysis of Portland Cement and Clinker,” Materials Science of Concrete VI, edited by S. Mindess and J. Skalny, American Ceramic Society, Westerville Ohio, 2001.
Struble, L., Cement and Concrete Research, Vol. 15, No. 4, pages 631-636, 1985.
Struble, L., Cement, Concrete, and Aggregates, Vol. 13, No. 2, pages 97-102, 1991.
Stutzman, P., Guide for X-Ray Powder Diffraction Analysis of Portland Cement and Clinker, NISTIR 5755, 1996.
Stutzman, P., personal communication to L. Struble, 2001.
Stutzman, P., Journal of Research, National Institute of Standards and Technology (NIST), Vol. 106, No.6,pages 1045-1050, 2002.
Stutzman, P., and Leigh, S., in Accuracy in Powder Diffraction III, National Institute of Standards and Technology (NIST), 2001.
USEPA (1993), “Report to Congress on Cement Kiln Dust, Volume I & Volume II, Office of Solid Waste and Emergency Response, United States Environmental Protection Agency, Washington DC, USA, EPA 530-S-94-001, December 1993.
Young, R. A., (ed.), The Rietveld Method, Oxford, 1995. Zumdahl, S., Chemistry, 3rd Edition, D.C. Heath, 1973.