Contents
Raw Meal Suspension In Calciner
[wpecpp name=”package + Updates forever” price=”250″ align=”center”]
1 Introduction
This chapter presents environmental aspects in case of cement industry, as well as general
description of the cement production. Then project description is introduced. Present chapter
was inspired by student project with the title Experimental investigation of heat transfer and
fluidization in a bed of cement clinker made by Arngrímsson et al. (2008, March).
1.1 Environmental aspect
Nowadays big effort is put on minimize emissions of carbon dioxide and energy
consumption. There are two main reasons of this fact: global warming (CO2 is a primary
greenhouse gas responsible for greenhouse effect) and vanishing of the crude oil reserves
(energy consumption simply means fuel consumption). In many cases those two aspects are
dependent of each other, because less fuel consumption usually means less carbon dioxide
emission. Reduction of CO2 emission and fuel consumption is noticeable in every field of
industry as well as in daily human life.
European Union has made a commitment, according to the Kyoto Protocol, that each EU
member (with some exceptions) needs to reduce CO2 emitted to the atmosphere by 8% by
2012 based on the emission level in 1990, regardless of the increasing energy consumption
(United Nations, 2007). Due to this fact, there is an incitement to build new industries and
modernize old facilities in a more environmental fashion. There is only one way to achieve
that – detailed insight into the processes, changing standards and trying new, innovative
ways.
Cement production is one of the major sources of carbon dioxide emitted to the atmosphere,
when only industry is taken into account. The reason is a huge consumption of cement – in
2007, the United States consumed 110.3 million metric tons of Portland cement, according to
the PCA (Portland Cement Association, 2008).
Production of one metric ton of cement results in the emission of roughly one metric ton of
CO2 and in some cases much more. Around 40% of this amount comes from combustion of
the fuel. Furthermore the energy consumption for producing one tonne of clinker is 3.2 GJ/t
for dry production and 5.8 GJ/t for wet production (Szabó et al., 2006).
1.2 General introduction1
1.2.1 What is cement?
Cement is a flour-like substance which is indispensable in the construction industry. Mixture
of cement, water and sand (or other fine filling) is used to bind together bricks, stones etc. by
applying it to the surface. Upon hydration, this mixture – so called mortar, it hardens and
becomes a rock-like material – concrete. There are several types of cement, depending on the
components used for production. Portland cement is the most common type of cement in
general use around the world.
Two main minerals are used to manufacture Portland cement. Usually these minerals are
limestone and clay, but also could be other raw materials containing the same chemical
constituents. The most significant component in the cement production is CaCO3 (calcium
carbonate) presents in limestone and the components of the clay like silicon, aluminium, and
iron oxides combined together in appropriate proportions.
There are also two alternative methods used to make cement: the wet process and the dry
process. It has to be noticed that cement produced from those two processes is identical. But
there is one significant difference, due to the presence of the water in the wet process which
needs to be evaporated: fuel and energy consumption (see Environmental aspect). Probably
this issue determined that most plants in the world are manufacturing cement with using the
dry process.
1.2.2 Cement production2
Portland cement is manufactured in a series of processes. They are presented on Figure 2.1.
All of these processes are interconnected and has influence on each other. So it is very
important to maintain conditions, for which production is optimum.
Cement production starts in quarries where limestone and clay are mined and crushed.
Location of the crushers could be at the quarry or at the plant (largely is a function of haulage
vs. conveying costs). Already crushed raw materials are mixed in the correct proportions and
stored in special stacker/reclaimer systems, where pre-blending is maintained. Afterwards
this raw mixture is ground in a raw mill. The product is fine powder, called raw meal. Before
proceeding raw meal further to the process, it is stored in special silos, where it is also well
blended. Then it is conveyed to a kiln system. The basic kiln system comprises a preheater in which raw meal is preheated by heat
exchange with hot exhaust gases, a rotary kiln in which the sintering occurs and a cooler in
which the hot product from the kiln exchanges heat with the ambient air. Modern kiln
systems comprise also a pre-kiln called calciner (secondary combustion vessel between kiln
and preheater) what makes the process more efficient. There are several types of kiln
systems, each with unique advantages depending upon the particular application. The main
difference between them is shape and functionality of the calciner.
The raw meal is dosed from storage silos to the preheater. The process of preheating is done
in a cyclone preheater which consists of one, two or even three parallel strings of cyclones
depending on the capacity of the rotary kiln. Each string consists of 4-6 cyclones, which are
arranged vertically, one above other in a zigzag formation. Preheating is done as a counter
flow process by heat exchange between hot exhaust gases comes from the rotary kiln and
cold raw meal from the silo

Preheated in the cyclone tower raw meal is transferred to the calciner, where calcium
carbonate dissociates and forms calcium oxide with the evolution of carbon dioxide. This
reaction is called calcination and it proceeds at 900oC according to the following formula:
![]()
![]()
Calcination is strongly endothermic reaction therefore an extra source of heat is required. It is
supplied through combustion of the fuel in a burner, which is placed at the bottom of
calciner. After calcination the raw meal is transported to the rotary kiln, where sintering
occurs at approx. 1450oC. To obtain such a high temperature, a burner is placed at the end of
rotary kiln. Basically sintering is a reaction of calcium oxide with the other components and
forming calcium silicates and aluminates. But in reality, raw meal undergoes a number of
complex physicochemical processes.
According to this fact and practical experience, the raw meal burning process in the kiln can
be divided into three main zones: calcining zone, burning zone and cooling zone. In calcining
zone the final calcination occurs – calcination degree in the calciner is in the range 90-95%,
(Dry Process Kiln Systems). During calcination, a considerable amount of dicalcium silicate
is formed (2CaO•SiO2 known as C2S). In burning zone, firstly raw meal is heated up to the
temperature of approx. 1330oC, when sintering starts. Temperature still increases and it
causes that liquid phase is formed in form of nodules – nodulisation. Then the main
component of Portland cement, namely tricalcium silicate (C3S) could be obtained according
to the following chemical formula:
![]()
![]()
The cooling zone begins when material passes the flame comes from combustion of the fuel
in the burner. Temperature decreases and liquid phase starts to solidify. The final product
leaving the rotary kiln (called clinker) is in form of black nodular material, with the particle
size in the wide range – from 10 to 500 mm. Also a reasonable amount of smaller particles as
well as dust leave the rotary kiln.
Clinker leaves the kiln at approximately 1200oC and then it is cooled down to less than
100oC in the cooler. Usually cooling is done in grate cooler. Clinker is transported through
the cooler by specially designed grate bars and the ambient air is blown up through the
moving clinker bed. A part of the air blown through the cooler is used as preheated air for
combustion of the fuel in the rotary kiln and the calciner as well. Cooled clinker is stored and
next milled with a small proportion of gypsum (to control the rate of hydration). The final
product is cement which is ready for packing and sending to the customers.
1.3 Project description
Calciners have become essential devices in the cement production. In general, calciner is a
specially designed vessel, where calcination of the raw meal as well as combustion of the
fuel occurs. There are many advantages of using pre-kiln like higher capacity of the rotary
kiln, reduction of the energy demand, reduction of NOx formation, etc – these aspects are
described later on (see ILC Kiln Systems). But there are also doubts as to designing of the calciner. Therefore, understanding of the mechanisms of flow and transport phenomena may
contribute to more efficient of production and better quality of cement.
This project deals with ILC Calciner (In-Line Calciner). Modern In-Line Calciners are made
with two compartments in order to ensure better calcination and combustion (see 2.3). The
purpose of this project is to study the distribution of raw meal to the upper compartment of
calciner. It was done by performing the experiments on a test model and investigating new
ideas concerned operation as well as structure.
Test model was scaled down and all of data required to manufacture it were taken from
Barbetti Cement Plant, which is placed in Gubbio in Italy. Test model was manufactured in
the way which gives possibility of simulation the full scale calciner as close as possible. The
model is running with preheated air (up to 80oC) and cold raw meal. The distribution of raw
meal was determined by mapping the temperatures in various cross sections of the tested
calciner. The output of experiments could be an incitement for redesigning the test model in
more efficient and optimum way, as well as validating and developing CFD models.
1.4 Limitations
This report does not provide detailed descriptions and specifications of devices included in
the experimental setup. Description is reduced to basic characterize the operation. The report
does not cover the results from experiments. There is presented just manner of data
processing and visualizing for the future analysis. The project does not provide CFD
simulations of the flowing air with raw meal particles.
2 ILC Kiln Systems
This chapter presents statement of the In-Line Calciner (ILC) kiln systems. Firstly different
aspects of kiln systems selection are presented. Then advantages of ILC kiln systems are
described and In-Line Calciner is characterized.
2.1 Kiln System Selection3
FLSmidth offers six standard dry-process kiln systems. Type selection depends on given set
of conditions and requirements. Choosing the right kiln system configuration is a
complicated task, because it has to be considered a number of criteria. The most important of
them are listed and shortly described below:
• Production capacity and investment costs
A simple suspension preheater system (without precalciner) requires bigger rotary kiln
dimensions then precalcining system. But rotary kiln diameter should not exceed 6 meters
(according to FLSmidth) what causes using kiln system with the calciner for production
capacity higher than 4000 metric tons per day. When the production capacity is bigger, also
more strings of the cyclone preheater could be required, because diameter of the cyclones
should remain within reasonable limits.
• Fuel
Kiln systems can be fired with several types of fuel, what requires special consideration.
Low-volatile fuels (e.g. petroleum coke, anthracite) can cause problems in the calciner,
because to combust them entirely, the temperature must be much higher. So calciners should
be designed in a way allowing raising the temperature in the combustion chamber with
keeping the optimal conditions for calcination.
Energy comes from combustion of fuels with high ash content (low calorific value) could be
insufficient to reach the temperature required in the rotary kiln. Furthermore, mixing in the
rotary kiln is not intensive and raw material is already nodulised. So it is very difficult to
obtain homogenous phase in contrast to the calciner, where the ash is well mixed with the
raw meal due to the high turbulence and material retention time.
here is also possibility to use combustible waste products as a fuel in the kiln systems.
These materials usually must be shredding and grinding before feeding to the kiln system and
these processes are rather expensive. Obviously combustion of these materials can not
influence negatively on the quality of the cement, emissions, capacity production, etc.
• Raw material
The content of volatile matter like potassium (K), sodium (Na), sulphur (S) and chloride (Cl)
is very important factor when selecting type of the kiln system. These components evaporate
in the kiln burning zone. Then they are carried with exhaust gas to the preheater where they
condense. High concentration of those species increases stickiness of the dust resulting
coating formation and cyclone blockages. To reduce this effect, a few percent of exhaust
gases is extracted from the system before they reach the preheater. The bypassed gas is
replaced with the air (if necessary) which is supplied to the calciner.
• Operation and maintenance
Precalciner systems are generally preferred to kiln systems without precalciner due to the
fixed calcination degree of the raw meal entering the rotary kiln and its shorter retention time
in the system. A single-string preheater is always preferable to double- or triple-string
preheater due to the maintenance costs.
• Heat economy
The specific heat consumption mainly depends on the size of the kiln, the number of
preheater stages, raw meal composition and the fuel type. Calculating heat balance requires
taking into consideration energy comes from following sources: energy of exhaust gas, dust,
free water and clinker at ambient temperature, heat of reaction, radiation loss from the
preheater and the kiln, cooler loss with subtracting energy of raw meal, air and fuel.
• Pressure loss and power consumption
The most power-consuming parts of the kiln system are Induced Draft (ID) gas fan motor,
the cooler fan motors and the kiln drive motor. The power consumption of the ID gas fan
mainly depends on the total pressure losses in the kiln system. Most of these pressure losses
occur in the cyclone preheater. Increasing the cyclone dimensions will reduce the pressure
loss. But there is certain minimum value which is required in order to maintain stable
operation of the preheater.
• NOx emission
In recent years, NOx emission has became an important issue for cement industry due to
more strict regulations. Because of that development of low NOx burners and kiln systems
has accelerated. More detailed description is in 2.3.
Selecting well-suited kiln system requires good knowledge about processes, which occur in
it. On the other hand, all types of kiln systems generally comprise the same equipment,
beyond the calciner, which differs from type to type. The main difference between calciners
is the position and the way of feeding raw meal, air and fuel. This causes different sizes and
shapes of calciners for each type of the kiln system.
2.2 ILC kiln system operation
This project concerns ILC kiln system. A typical ILC kiln system with In-Line Calciner4 is
presented on Figure 2.1. Raw meal is dosed to the first top cyclone of the cyclone preheater
and in every stage it encounters exhaust gas comes from the rotary kiln and the calciner.
Preheated raw meal from second last cyclone feeds the calciner in two or three places
(depending on a number of compartments), where it undergoes calcination. Calcined raw
meal is transported with smoked gases to the last bottom cyclone of the preheater, where it is
separated and finally enters the rotary kiln.

The heat required for calcination is obtained from combustion of the fuel, which is fed to the
lower part of the calciner. At this place, also combustion air, called tertiary air is supplied.
Firstly tertiary air is preheated in the clinker cooler and then transported in the tertiary air
duct to the calciner.
The exhaust gas in the rotary kiln (gases from calcination and combustion) encounters
sintered raw meal and enters the calciner from the bottom. Together with smoked gases from
calcination and combustion in the calciner, they are transferred to the cyclone preheater
Cooled exhaust gases containing rest of the raw material5, are transported to the baghause
filter, where they undergo separation. Raw meal from the baghause filter is added to the
preheater again, whereas smoked gases are blown to the air.
2.3 InLine Calciner

Modern In-Line Calciners consists of two compartments. One of the reasons is lower NOx
emission. Basically NOx can be formed in two ways in the kiln system (Thomsen et al.,
1998):
• Thermal NOx – it is formed by reaction between nitrogen and oxygen in the
combustion air
• Fuel NOx – it is formed by reaction between nitrogen in the fuel and oxygen in the
combustion air
Thermal NOx formation is normally only important when temperature exceeds 1500oC,
whereas fuel NOx is formed regardless of how the temperature is. So when kiln system
comprises calciner, part of the fuel is burnt there and NOx formation becomes less significant
due to low operational temperature. But on the other hand, when the temperature is higher
during initial combustion, the NOx formation is lower (Thomsen et al., 1998). Another reason
of splitting calciner on two compartments is to ensure combustion of entire fuel, especially if
it is low-volatile. High temperature promotes faster combustion, because combustion rate
doubles with raising the temperature by 70 K (Roy, 2002). On the other hand the temperature
cannot exceed the equilibrium temperature for calcination (850 – 900oC), as long as
reasonable amount of carbonates are present (Roy, 2002). Therefore operating conditions of
both compartments differ from each other. They are shortly described below.
2.3.1 Down Compartment
Down part of the calciner is also called hot chamber, because it operates at higher
temperature than upper part. The fuel for combustion, which is approx. 55-65% of the total
fuel consumption (Dry Process Kiln Systems), is fed at the bottom part of the calciner. At
this place, small fraction of preheated raw meal is added – approx. 15-25% (Kasch and
Thomsen, 2003). The purpose is to reduce coating formation as the volatile components (Cl,
K, and Na) condense on the raw material particles (Hundebøl and Rosholm, 1994), to
minimize NOx formation, but also to control the temperature (Iliuta et al., 2002).

In the middle of the cone, the tertiary air for combustion is introduced and initial combustion
takes place. The tertiary air is fed in the way, which lets to obtain swirling flow in order to
improve mixing of the raw meal and the fuel. This effect is shown on Figure 2.3. Slightly
higher, at the beginning of cylindrical part, main part of raw meal is fed.
This compartment is separated from upper part with restriction, in order to ensure better
mixing of the raw meal with the fuel and the air. The diameter of restriction is as small as the
ratio of its cross sectional area and calciner cross sectional area equals approx. 0.5 (FLSmidth
designing rules). The temperature in this compartment is maintained within the range 925-
1050oC (Roy, 2002), in order to fulfil criteria described above (lower NOx and maximum
combustion of the fuel).
2.3.2 Upper compartment
Usually, this compartment is longer than the down part – but could be also equal. The
suspension flowing up from hot chamber is mixed with combustion air and remaining
preheated raw meal (20-40%), which is fed slightly above the restriction. As oxygen from
combustion air is mixed into the flow, combustion takes place and the heat is released. Then
the raw meal is calcined. If the heat from combustion is released more rapid than the rate of
heat consumption by calcination, the temperature rises. Therefore it is important to control
the process to maintain possible constant temperature, close to the equilibrium calcination
temperature.
Suspension of smoked gases and calcined raw material are transported to the cyclone, where
they are separated. Pipe connecting the calciner and the cyclone, so called swan neck is also
very important. It has to promote well mixing of components and prolong particle retention
time in order to ensure entire calcination and combustion of the fuel.
2.3.3 Spreader box
Raw meal is fed to the In-Line Calciner usually in three places. It is important to deliver raw
material to the calciner in dispersed form, which could increase calcination process.
Therefore, solid particles are delivered to spreader boxes (also called distribution boxes) and
further they are spread into the calciner.
Design of spreader boxes should let to obtain better distribution of the raw meal, when it
enters the calciner. There are few important parameters, which need to be considered during
designing of distribution boxes system. First of all, proper velocity and pipe filling ratio
should be obtained. Dimensions of pipes transferring the raw material (like height, diameter
and angle between this pipe and calciner) have big influence on these parameters. Also shape
(radius of bending) and angle position of the metal sheet, on which raw meal falls, are
important issues. Typical spreader box and pattern of raw meal distribution coming out from
it, is shown on Figure 2.4. It has to be noticed, that presented distribution is just theoretical
example. This project could be expanded and an investigation of the spreader box could be
made using the same test setup.

3 Cold model
This chapter describes step by step scaling down full-scale calciner installed in Barbetti
Cement Plant. Firstly exhaust gas composition is calculated. Next properties and volumetric
flow of exhaust gases are computed. Finally, dimensions of cold model are found with taking
into consideration geometry and process limitations.
3.1 Model design
A cold model of the calciner is running with electrically preheated air (up to 80oC) and cold
raw meal. The model was designed in the way which lets to obtain close conditions to the
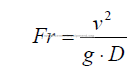
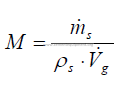
real scale. Therefore three dimensionless numbers – Froude number (Fr), Reynolds number
(Re) and loading number (M), which describe most important phenomena occurring in the
calciner, should be the same as in the large scale. These numbers are shortly described below.
Froude number is a ratio of inertial forces and gravitational forces. It is used to quantify the
resistance of raw meal in the moving air. It is expressed by equation:
Reynolds number is describing flow intensity of the air. It is defined as a ratio of inertial
forces and viscous forces:

Loading number is a dimensionless number describing load of solids. It is expressed as a
ratio of volumetric flow of raw meal and air:
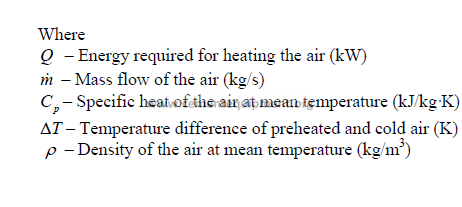
Where:
v – Gas velocity (m/s)
g – Gravitational acceleration (m/s2)
D – Internal diameter of calciner (m)
ρ – Density of gas (kg/m3)
μ – Dynamic viscosity of gas (Pa·s)
s m – feed rate of solids (kg/s)
s ρ
– Density of solids (kg/m3)
g V – Volumetric flow of gas (m3/s)
Comparing those dimensionless numbers for model and full scale calciner gives a solution in
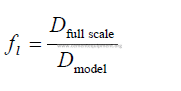
form of diameter and velocity of exhaust gases (see section). The internal geometry of the
model was obtained by scaled down full scale calciner with using linear scale factor, which is
expressed by Equation 3.4:
3.1.1 Data from the full-scale
Cold model was designed by scaling down full scale calciner in Barbetti Cement Plant. Data
required for scaling the calciner and other relevant information are presented below. It has to
be noticed that some of the data are taken as an average values in order to simplify
calculations.
The basis for the following calculations is a cement plant which produces 4000 metric tons of
clinker per day. It has to be noticed that amount of clinker is equal approximately 65% of
entire amount of raw meal feed to the kiln system. This is because of loss on ignition (LOI)
of the raw meal during calcination process. Internal diameter of the installed ILC Calciner is
6900 mm. The gas flow out of the calciner is a mixture of CO2 from calcination and smoked
gases from combustion of the fuel (both the fuel fired in rotary kiln and the fuel fired in the
calciner). The temperature in upper compartment of the calciner (also temperature of exhaust
gases) is 875oC. The gas flow in down compartment is less about amount of carbon dioxide
comes from calcination of the raw meal added above restriction (20% – 40% of total feed of
the raw meal). Anyway volumetric flow of smoked gases in the upper part of the calciner is
close to the flow in down part due to the fact that the temperature in this compartment is
higher (e.g. 1000oC). It was assumed that gas flow is the same in both compartments.
The total fuel consumption is 750 kcal/kg of clinker of net calorific value. The excess of the
air used for combustion is 15% (excess air factor is equal λ=1.15). There is atmospheric
pressure in the calciner with slight underpressure, which is 1500 Pa. The exhaust gas follows
the ideal gas law.
3.2 Exhaust gases
First step of scaling down a full-scale In-Line Calciner was calculation of flow and properties
(density and viscosity) of exhaust gases coming out from the calciner. Therefore composition
of gases which leave the calciner was computed.
The exhaust gases come from combustion and calcination. Therefore chemical analysis of
fuel and raw meal needs to be made in order to know the composition of exhaust gases. Data
of chemical analysis as well as process date were taken from Barbetti Cement Plant. Total
coal consumption is about 750 kcal/kg of clinker. The net calorific value of combusted coal
is 7553 kcal/kg. It means that approx. 100 kg of coal needs to be burnt in order to provide
required energy for producing 1000 kg of clinker.6
3.2.1 Smoke gases7
Smoke gases consists of carbon dioxide and water vapour, which come from combustion of
carbon and hydrogen respectively, rest of oxygen which did not react (due to the excess of
air) and inert components (mainly nitrogen). Usually, combustion gases contains also
significant amount of SO2. But in case of cement production, sulphur of the fuel is burnt into
SO3 and then it is captured by CaO forming CaSO4.
Oxygen required for combustion can be calculated using data from analysis of the fuel. The
coal composition and reactions between components and oxygen (if any) are presented in
Table 3.1.
Where
M – Molar mass of the component (kg/kmol)
m – Mass of the component (kg)
Thus oxygen demand (in kmol) for combustion of 100 kg of coal is as follows
Last value is an amount of oxygen which is contented in the coal. Thus total oxygen
consumed during combustion equals 7.7619 kmol. But this amount is very often slightly
higher than demanded (so called excess air), in order to ensure entire burning of the fuel. The
excess air factor is equal λ=15%. It means that final oxygen quantity introduced to the kiln
system equals 8.9262 kmol. Oxygen presents in smoke gases is the amount which did not
react, thus it is equal 1.1643 kmol.
Oxygen is delivered to the kiln system as an air component. Assuming that air contains only
oxygen and nitrogen in proportion 21% to 79% respectively, amount of nitrogen introduced
for combustion together with oxygen is as follows:
![]()
![]()
Nitrogen consumption during combustion is negligible (NOx formation is very low (<< 1%)
comparing with total quantity of exhaust gases). Thus nitrogen in smoke gases is increased
about amount presents in the fuel and it is equal 33.65 kmol.
Amount of carbon dioxide and water vapour formed during combustion are obtained using
already known amount of oxygen:
CO2: 6.8 kmol (the same number of moles)
H2O: 0.7986 ⋅ 2 = 1.5972 kmol (twice more numbers of moles)
3.2.2 Gases from calcination
Calcination proceeds according to the chemical formula presented in Equation 1.1. During this
process, only carbon dioxide is formed, when calcium carbonate undergoes thermal
deformation. The amount of CO2 can be obtained knowing LOI of the raw meal (loss on
ignition). LOI of the raw meal is usually around 35% (raw meal analysis of raw meal from
Barbetti Cement Plant). It simply means that production of 1000 kg of clinker requires use of
much larger amount of raw meal, which is calculated in following way:
It can be assumed that CO2 comes from calcination is the difference between amount of raw
meal and amount of clinker. Thus number of moles of CO2 equals:
Final exhaust gases composition is presented in Table 3.2.

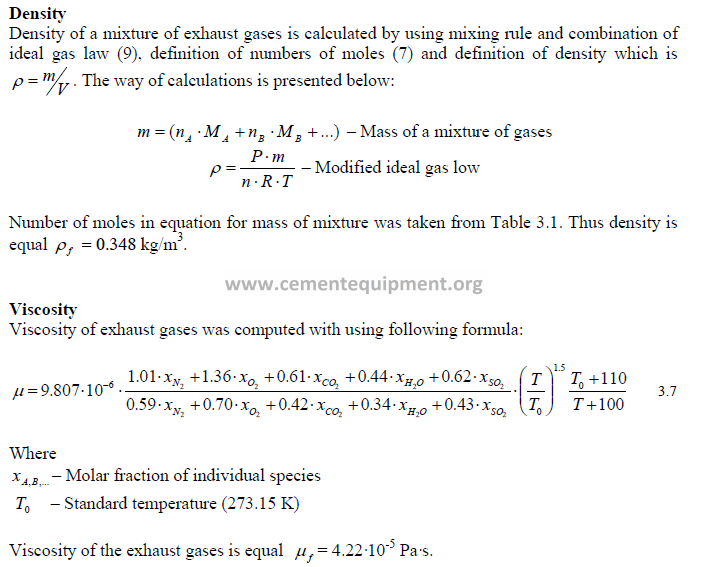
3.2.3 Parameters and properties of exhaust gases
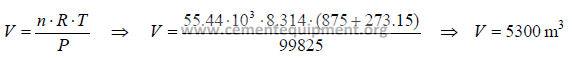
Volumetric flow
It was assumed that exhaust gases follow ideal gas low, which is expressed in 7. Knowing
number of moles, temperature and pressure in the calciner (based on upper compartment),
volume of the exhaust gases could be calculated (based on 1000 kg of clinker production).
P ⋅V = n ⋅ R ⋅T 3.6
Where
P – Total pressure (Pa)
V – Volume of the gas (m3)
R – Universal gas constant (Pa·m3/mol·K)
T – Temperature (K)
n – Number of moles (mol)
Thus volume of exhaust gases per 1 ton of clinker is equal:
3.3 Scaling the calciner
The calciner was scaled down by using dimensionless numbers presented in 0. Firstly those
numbers were calculated for full-scale conditions of process. Next, diameter of calciner and
velocity of exhaust gases were extracted from the same dimensionless numbers (but for cold
model conditions). It has to be mentioned, that there is only one solution, when all three
dimensionless numbers are the same for both, cold model and full-scale. Furthermore, there
were some geometric and process constraints, which limited dimensions of the calciner.
3.3.1 Geometry limitation
Cold model was mounted in the room where the old test rig was placed. Therefore, there
were limited place for calciner – height constraints. Full-scale calciner has height equal
approximately 58.5 m (including height of the rotary kiln and swan neck). Diameter of the
full-scale calciner is 6900 mm (lining thickness is 240 mm). Thus height to internal diameter
ratio is as follows:

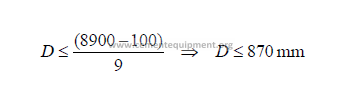
In the cold model, there was also considered extra place under the calciner (around 1 m) for
collecting the raw meal in emergency situation e.g. cut off the power (raw meal would be
stuck in the bottom of the calciner). Therefore, internal diameter of cold model should not be
bigger than 870 mm:

3.3.2 Fan capacity
Already existing test rig (see Figure 3.1) contains fan which capacity is equal approximately
1 m3/s at standard temperature (Ts = 20oC). Using ideal gas low P ⋅V = n ⋅ R ⋅T
3.6), given volumetric flow could be recalculated at conditions at which cold model is
operated (T = 80 C).

It has to be mentioned, that test setup is using extra air required for dedusting system. There
is also “false air” due to the slight underpressure in the system. Typically, sum of the flow of
extra air is up to 20% of total volumetric flow. It means, that maximum air flow in the
calciner, which could be obtain at T = 80oC using described fan, is as follows:
![]()
![]()

As it can be seen in 3.3.1, calculated diameter is too high in order to install model into the
existing test rig. On the other hand, Reynolds number is very high, what gives the possibility
of calculating diameter without this dimensionless number. This is because turbulence flow
does not change its structure significantly with changing Reynolds number, as long as Re >
50000. Therefore, diameter was found using only two dimensionless numbers (Fr, M). Table
3.3 presents solutions for the set of diameters, when two dimensionless numbers (Fr = 0.91
and M = 1.1·10-4) are fixed.

Taking into consideration limitations described above (subsections 3.3.1 and 3.3.2) and
reasonable high Reynolds number, internal diameter of the calciner of tested setup was found
as D = 700 mm.
3.3.4 Designing the calciner
As diameter was calculated, calciner was designed and manufactured. The internal geometry
of the model is nearly the same as the internal geometry of the full-scale calciner (apart from
linear factor – Equation 3.4. In-Line Calciner operated in Barbetti Cement Plant was scaled
down and required drawings were downloaded from FLSmidth database (example of these
drawings is shown on Figure 2.2 and Figure 3.1).
Main difference between Barbetti Calciner and model is that in full-scale compartments have
different heights, where compartments of scaled calciner are the same. Nevertheless, total
height is exactly the same (multiplied by linear factor) in order to obtain the same retention
time. Full-scale calciner has two branches of swan neck, where cold model has just one, but
with bigger diameter (diameter is as big as cross-sectional area is the same for full-scale and
model). This projected concerned distribution of raw meal only in upper compartment.
Therefore, raw material is fed only to this part, what means that there is just one spreader
box.
Calciner was mainly made from Plexiglas in order to have possibility of visual investigation
of the process. Along with calciner, last cyclone of the preheating tower (counting from the
top) was designed and manufactured, in order to collect raw meal used in experiments. This
cyclone was design according to FLSmidth standards with appropriate scaling down.8
Described model is shown on see Figure 3.2.

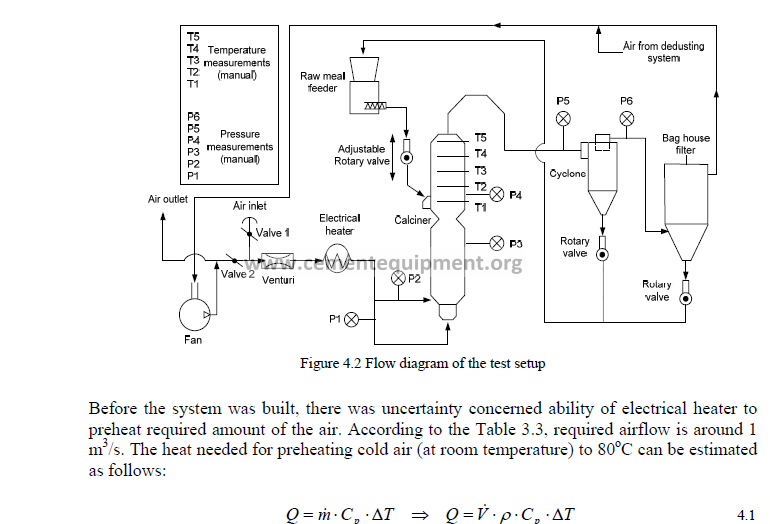
4 Experimental setup
This chapter presents test setup with short description of the operation of the most important
parts as well as control system.
4.1 PILOT 0
Experiments connected with this project, which concern investigation of raw meal
distribution in the calciner, mainly relies on measurements of the temperature across the
calciner. Therefore, calciner is run with hot air (80oC) and fed raw meal is in room
temperature, what gives possibility of finding cold spots – places with high raw meal
concentration. Firstly, experiments were made under conditions in accordance with full-scale
process (see Table 3.3). Output of these tests would give further investigation with change of
various parameters like flow of the air, feed rate of the raw meal, position of metal sheet in
spreader box as well as redesigning the calciner.
That is why calciner was placed in already existed test rig (called in FLSmidth R&D Centre
as Pilot 0), which contains required systems for described above experiments:
• Feeding system – it contains a receiver bin for storage of solids (raw meal), a feeder
for feeding raw meal with demanded rate, rotary valves for control feed rate and keep
it constant, an elevator for deliver raw meal from the receiver bin to the feeder, small
receiver bins for collecting raw meal coming from cyclone and baghouse filter, and
required connections between these devices.
• Baghouse filter – it collects raw meal present in the air, in case of this project the air
is coming from the cyclone.
• Fan system – it contains fan for airflow through the system, board air inlet and outlet
(chimney), Venturi tube, and piping system.
• Dedusting system – it is used for dedust air which may contain still significant
amount of solids.
Picture of Pilot 0 with already installed devices required for this project is shown on Figure
4.1.

4.2 Test setup operation
Test setup operation mainly relies on airflow through the system and feeding the raw meal
into the calciner. Firstly cold air is sucked through a board air inlet – specially designed air
inlet with low pressure losses. Then it flows through Venturi tube, where differential pressure
is measured and flow is calculated. Next, air is preheated up to 80oC in 75 kW electrical
heater and then split in two streams. These streams simulate gases in real process – tertiary
air and kiln exhaust gases. There are two orifice plates. They are placed in tubes after the
distribution of the air, where the pressure is measured (P1 and P2) in order to obtain required
flow division. Next the air reaches the calciner. There are two pressure measuring points (P3
and P4) in the calciner – in order to know pressure loss through restriction.
Raw meal is fed to the upper compartment of the calciner. It comes from the raw meal
feeder, through the pipes to the spreader box. At this place, cold raw material is mixed with
preheated air and temperature is measured in order to determine distribution of the raw meal.
The temperature is measured in five heights of the calciner (T1, T2, T3, T4, and T5).
Measurements are done by using a rod containing seven thermocouples. At each height,
temperature is measured at four intersections of the calciner. It means that temperature is
measured in 28 points (which are symmetrical) for each cross-sectional area of the calciner –
more detailed description of the measurements can be found in 5.2.
Next mixture of the air and the raw meal flows to the cyclone, where separation occurs.
Before and after cyclone are placed two pressure measuring points (P5 and P6) in order to
know pressure loss. Air from the cyclone flows to the baghouse filter and further separation
occurs. Then dedusted air flows through the fan to the chimney. Raw meal collected in the
cyclone and bag house filter is transported to the receiver bins. They are periodically emptied
– the raw meal is delivered to the main receiver bin and then to the raw meal feeder. The
flow diagram of described system is shown on Figure 4.2.
The heat required for preheating air is Q ≈ 66 kW (without losses to surroundings). Due to
the fact, that power of electrical preheater is 75 kW, test setup was designed as a close
system. The air recirculates in the system what significantly decreases required capacity of
the heater. Two automatically controlled valves were installed in the system – at the air inlet
(Valve 1) and between chimney and Venturi tube (Valve 2). Opened system is when Valve 2
is closed and Valve 1 is opened and vice versa for closed system.
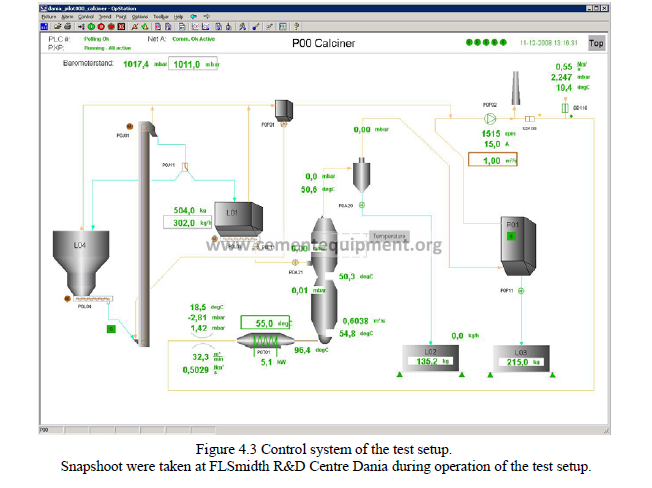
4.3 Control system
Experimental setup is controlled by using automation toolbox called ECS/ProcessExpert,
which is combination of two others software. ProcessExpert (PXP) is used as a calculating
editor, where required data are calculated usually using measured values. ECS is a
programmable logic controller – so called PLC, which is designed for multiple input and
output arrangements in nice graphical form. Basically, ECS system lets to control the
operation of the system by monitoring all of required data (measured as well as calculated in
PXP) and adjusting key parameters, called set points (SP). ECS system stored all of
measured data as well as calculated data in PXP with possibility of plotting them. Snapshoot
for the calciner system taken from ECS/ProcessExpert is shown on Figure 4.3.
5 Experiments
In this chapter the way of carrying out the experiments is presented. Firstly right airflow
division (tertiary air to kiln gases) is chosen through visual investigation as well as CFD
simulations. Temperature measuring devices and measurements are described. Next way of
analyzing data from measurements is introduced and results are shown on plots.
5.1 Airflow division
In full-scale calciner, typical airflow division is approx. 55% of the tertiary air and 45% of
the kiln gases (according to the calculation made for scaling calciner at Barbetti Cement
Plant). The flow pattern for this division was sketched and it is shown on Figure 2.3. But this
project concerns investigation of the raw meal distribution to the upper compartment. It
means that flow cannot be divided with this ratio, because there are gases come from
combustion of the fuel and calcination of the raw meal in down part of the calciner. Similar
situation is in upper compartment, where calcination of the raw meal occurs as well. It is
known, that flow pattern of gases with particles of raw material in upper part of the calciner
does not show the swirling effect (Drivsholm, 2008). Therefore right airflow division was
obtained through carrying out CFD (computational fluid dynamic) simulations as well as
visual observations of experiments.
5.1.1 CFD simulation
Calciner was drawn and meshed in Gambit. Mesh was made from tetrahedral cells with total
amount of 60625. Mesh does not consider regions with high velocity gradient – surroundings
of the wall (boundary layers) and regions with complicated flow pattern – what means that
cells are with similar size in all volume. It was assumed that this aspect do not have big
influence on results, especially when output was just estimation of the flow pattern. Meshed
calciner is shown on Figure 5.1.
Next, mesh was exported to FLUENT. Simulations were carried out by using realizable kepsilon
model with all default constants. Velocity specification method for both inlets and
outlet was chosen as magnitude, normal to the boundary. Turbulence specification method
was chosen as intensity and hydraulic diameter, where relevant parameters were calculated
according to the Fluent User’s Guide. Discretization was chosen as second order for pressure
and second order upwind for the rest of parameters with default under-relaxation factors.
Energy equation was not considered in the simulation as air in both inlets has the same
temperature. It causes that heat losses in the calciner were omitted. It was assumed that
simplifications of settings in FLUENT do not cause different flow pattern obtained from
simulation comparing with real scenario. Convergence criterion was set to 10e-5 and it was
fulfilled within approx. 1800 iterations for all cases. In order to check the correctness of the
simulation, report of fluxes were made. In each case, difference in mass flow between inlets
and outlet were around 10e-6 (kg/s).

Simulations were carried out for different ratios of the air causing swirling effect (tertiary air)
and air comes from the bottom of the calciner (kiln gases). On Figure 5.2 (Picture A), it is
shown pattern of the airflow with ratio 55 to 45% of the tertiary air and kiln gases
respectively (as in full-scale). As it can be seen, tertiary air has quite strong influence on the
flow pattern causing that air swirls in the calciner – there is around one revolution in down
compartment. Swirling effect in upper part is slightly smaller. It is because air loses its
rotational velocity in aid of vertical velocity when passing the restriction.
Pattern of the airflow with ratio 20 to 80% of the tertiary air and kiln gases respectively is
shown on Figure 5.2. For this conditions, air flows almost straight up with very tiny swirling
effect, which vanishes almost entirely after the restriction. Flow in upper part can be
described as a combination of three components – the core with lower velocity and two
regions at the opposite sides with higher velocity. Similar effect occurs in full-scale calciner.

5.1.2 Visual observation
Choice of the right air division was done by observation of the behaviour of the raw meal in
the calciner for several ratios of tertiary air and kiln gases. It was possible due to the
transparency of the wall of calciner (the wall was made from Plexiglas). When flow of
tertiary air dominates (60 to 40%), particles fluctuate up and down on the wall. But main
pattern is similar to the one simulated in FLUENT (with strong swirling effect) – Figure 5.2
(Picture A). The reason of these fluctuations could be that particles lose their kinetic energy
and gravity starts to play important role until the particles are swept again by the air – similar
effect like in cyclone. Particles in the core of the flow seem to behave like under casual
turbulent flow in a straight pipe – plug flow with very well mixing effect.
Desirable flow of the air with raw meal in upper compartment is when there is no swirling
effect and particles move straight up with some local whirls. Similar effect was found for
around 20 % tertiary air of total flow. It was assumed that distribution of raw meal in upper
part of test model with air division of ratio 20 to 80% and parameters calculated in 3.3.4
(dimensions of the calciner, total airflow, and mass flow rate of raw meal) is very close to
distribution in calciner at Barbetti Cement Plant.
5.2 Temperature measurements
Experiments concerned this project relies on measurements of temperature in the calciner,
what could give the view of how raw meal is distributed in various conditions of the process.
Temperature is measured through placing a rod with thermocouples in the calciner in various
points (there are holes made in the wall of calciner) – see Figure 5.3. These points are located
in the way which lets to obtain symmetrical temperature field. Thermocouples are connected
with ECS/ProcessExpert software, where temperature is stored. There is also possibility of
simultaneous observations of temperatures during the experiments thanks to display mounted
close to the calciner.

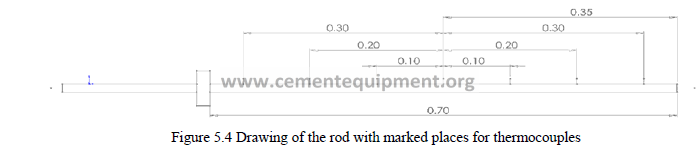
5.2.1 Rod with thermocouples
There are seven thermocouples placed in the rod. “Working length” of the rod is equal 700
mm – this part is inside the calciner during experiments. Thermocouples are in equal distance
from each other and it is equal 100 mm. Central thermocouple is exactly in the middle of
“working part” of the rod (it is in the middle of the calciner during tests). Temperature is
measured in seven thermocouples simultaneously. The rod is insulated and sealed in order to
minimize heat losses and avoid suction of cold air respectively. Those two phenomena cause
that temperature of two thermocouples close to the handle of the rod is significantly lower.
This error is comparable with temperature difference between regions with high and low raw
meal concentration. The rod with thermocouples is shown on Figure 5.4.
5.2.2 Temperature field
Temperature is measured in five heights in upper part of the calciner. Distance between
heights is the same and it is equal 300 mm. First height is placed 250 mm from the beginning
of the upper compartment of calciner. There are four measuring lines in each height. They
are symmetrical – angle between each line is equal 45o. For one measuring line, there are
seven points, where temperature is measured. It means that temperature is measured in 28
points for each cross section. Temperature in the centre of calciner is measured four times
and an average value is taken for data analyzing. Cross section area of the calciner with
measuring points is shown on Figure 5.5.
5.3 Data processing
Signal comes from the thermocouples is stored in ECS/ProcessExpert database in form of
temperature (in Celsius degrees). Data processing is carried out in Microsoft Office Excel.
Analyzing the results from experiments is mainly based on plotting the temperature field for
each cross section area. Plots of the temperature field are made for surface consists of square
matrix with 49 elements (7×7) – because of seven measuring points in one line. There are 28
measured points from the experiments. It means that there are 21 missing points (49 elements
of the matrix minus 28 measured points). These points are taken as the mean value of
appropriate measured points (or in some cases as the same value). This way of presenting
temperature in the calciner is shown on Figure 5.5.

On this sketch, numbers represents number of thermocouple e.g. the farthest thermocouple
from the handle of the rod is thermocouple number 1. Letters represents number of
measuring line – position of the rod with thermocouples e.g. line A is first measuring line,
right after the spreader box. On the sketch, measuring lines are marked as red dashed lines.
Red fonts represent measured values of the temperature. However black fonts represent
calculated values. Intersections of blue circles and red dashed lines show places of the
thermocouples in the calciner. This method lets to obtain temperature field in the calciner
with reasonable solutions.
5.4 Preliminary results
Preliminary experiments were analyzed and they are shown on Figure 5.6 and Error!
Reference source not found. (both figures present solutions of the measurements for one
condition of parameters for five heights of the calciner). There are two kinds of plots
expressing temperature in the cross section area of the calciner. Plots on the right are more
readable, because temperature is expressed not only with using colours but also with heights.
Drawback of this kind of plot is difficulty with mark the calciner – blue circle on the left plot.
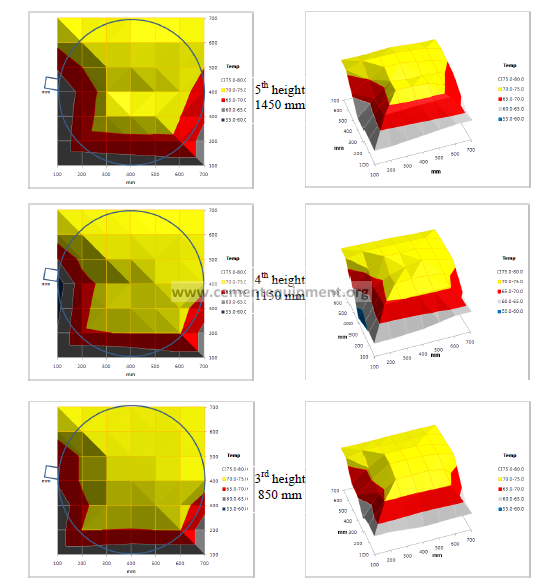
Figure 5.6 Temperature field for three heights of the calciner – from the top of upper part.
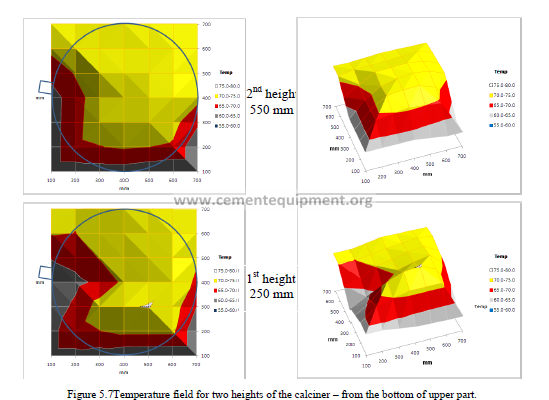
Plots shown on Figure 5.6 and Figure 5.7 were made for conditions when dimensionless
numbers (Fr and M) are the same like in full-scale. Airflow division was 60 to 40% of
tertiary air and kiln gases respectively. It was noticed that area close to the wall from the side
of the handle of the rod is much colder. The reason is conduction of the heat through the rod
and suction of the cold air into the calciner, because these experiments were carried out
before the rod were insulated and sealed – see 5.2.1.
Temperature measurements presented in this project are not very accurate. Measurement
errors of the thermocouples are up to 2 degrees. Error arises from suction of cold air and heat
conduction was decreased but still is approx. 1-2 degrees. Nevertheless, these experiments
are good enough to distinguish zones with high and low raw meal concentration and gain
required knowledge for further investigations of the transport phenomena occurred in the
calciner.
6 Conclusion
This report is an overview of the work, which has been done during the internship at
FLSmidth R&D Centre Dania. Major aim of this project was gaining the knowledge about
distribution of raw meal in the calciner. For this purpose, In-Line Calciner was built and
placed in already existed test rig and preliminary experiments were carried out. Right tests
would be done after submission of this report.
Process of cement production as well as operation of kiln systems was studied in order to
obtain more detailed knowledge, understand processes and simulate them in cold tests. Based
on this information, In-Line Calciner placed in Barbetti Cement Plant in Italy was scaled
down. Scaling relied on calculation of composition and flow of the exhaust gases coming
from combustion and calcination by using chemical analysis of the fuel and raw meal. Then
size of the model was found with using dimensionless numbers and calciner was designed
and built. Next preliminary tests were carried out with simultaneously corrections and
adjustments.
Beyond calculations and investigations described above, there were analyzed other tasks,
which were not included in this report. For instance, heat losses in the open/closed system
were calculated in order to match the electrical heater. Estimation of pressure losses in the
system was done to check whether already mounted fan was big enough. Sizing the orifice
plates and Venturi tubes were studied in order to design airflow division and check
correctness of the measurement, respectively. During composing this project, there were a lot
of tasks to work with and some of them could be continue in the future.
6.1 Future Work
As it was mentioned, this report does not include right tests analysis and this is priority for
the future work. Experiments could be carried out not only for different sizes of the spreader
boxes, angle of the metal sheet in spreader boxes and airflow division when rest of
parameters are fixed, but also for different airflow and mass flow of raw meal. Redesigning
the calciner is also desired work for the future. These experiments could be compared
simultaneously with CFD simulations what may contribute to validate existing models or
invent new ones.
It was checked that experiments based on temperature measurements are not very accurate. Ii
is relevant to find better, more reliable method for measuring distribution of raw meal. Size
of the particles plays important role in cement production; therefore method which gives this
information could be a good idea.
Another area that could be investigated using Pilot 0 is pressure loss in the cyclone and its
efficiency. It possible due to transducers mounted before and after the cyclone and weight
system which lets to calculate amount of particles which does not leave the cyclone.