Contents
Cement Separator & Ball Mill Optimization
When: Do optimization
1. In some period (1 month, 1 Quarter, 1 Year or ???)
2. To assess the reason/cause of disturbance
– When abnormal peration
– Poor performance of grinding system
– Low mill output or pool quality product
-High operation or maintenance costs
3. Keep operation in a good efficiency
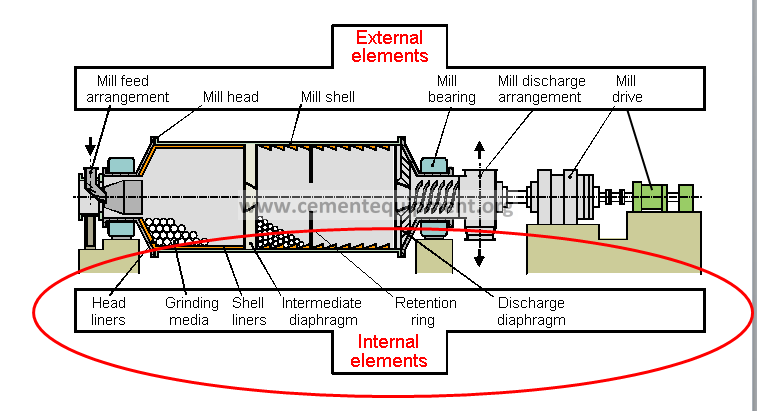
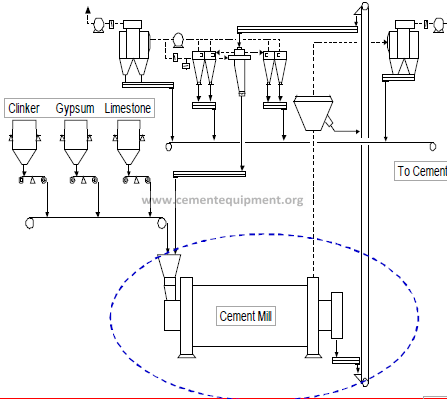
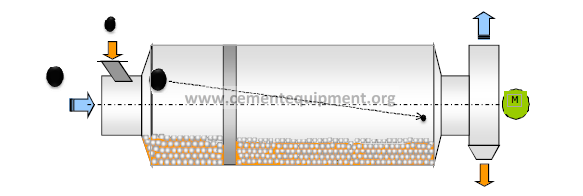
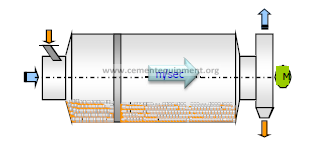
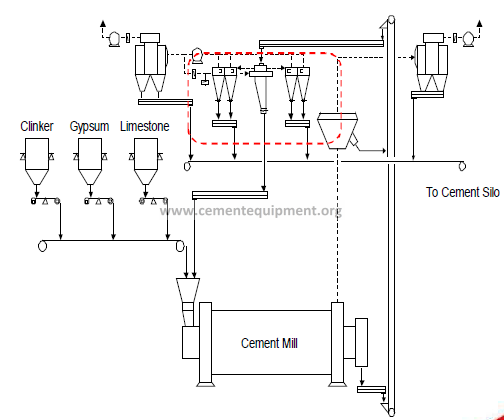
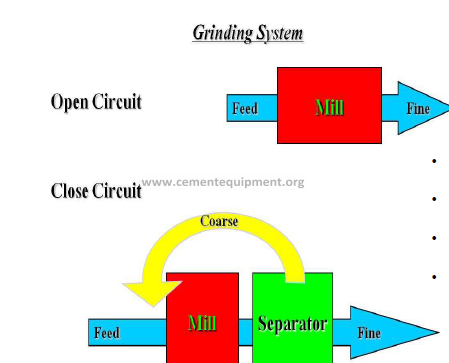
Conventional grinding system
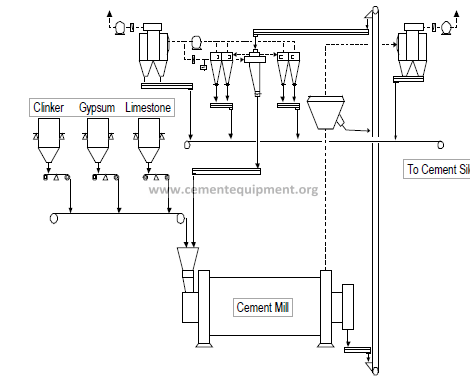
Main Machine
1. Feeding system
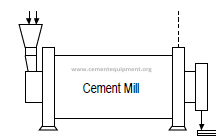
2. Tube mill
3. Dynamic separator
4. Dedusting (BF/EP)
5. Transport equip.
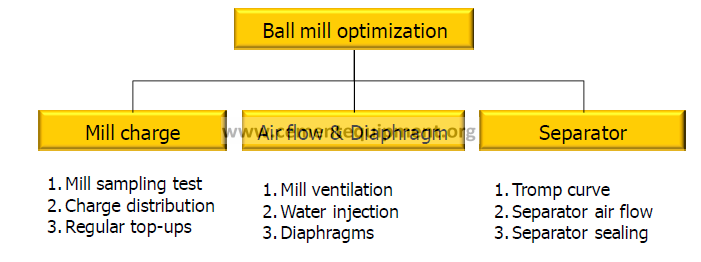
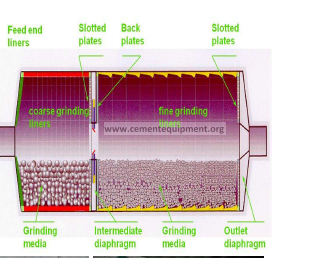
Mill charge optimization
What is function of mill?
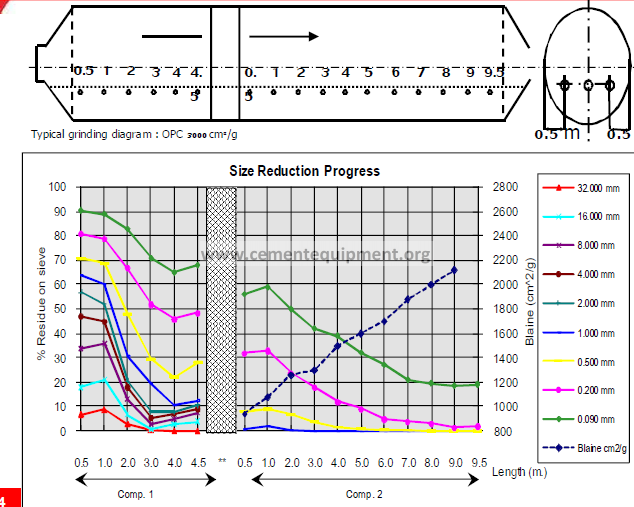
Size reduction along the mill
-Coares grinding —> 1st compartment
Normal feed size 5% residue 25 min
Max feed size 0.5% residue 35 min
-Fine grinding —-> 2nd comparment
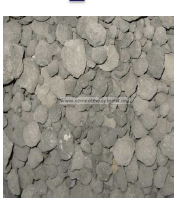
Coarse material grinding
Piece weight (or knocking weight)
-Average weight / piece of grinding
media in each compartment
(g/piece)
– Piece weight Impact force
—> Need large ball size
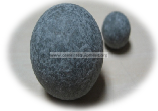
Fine Material grinding
Specific surface
Average surface area of (ball)
grinding media in each compartment
(m2/t)
Specific surface Attrition force
—-> Need small ball size
Ball charge composition
Calculation (for steel ball)
-Piece weight : i = [3.143/6] x d3 x 7.8 ;g/pcs.
-Specific surface : o = 123 / i (1/3) ; m2/ton
*Note : d = size of ball (cm)
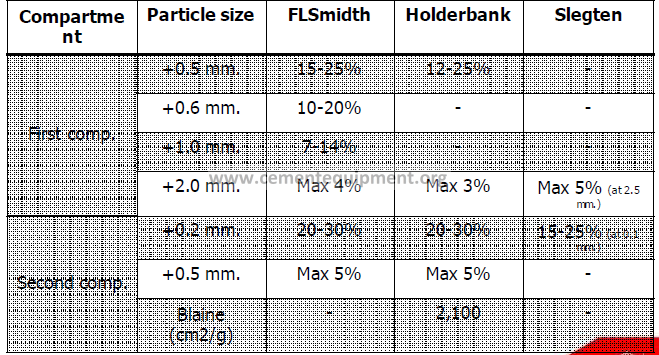
Ball charge composition
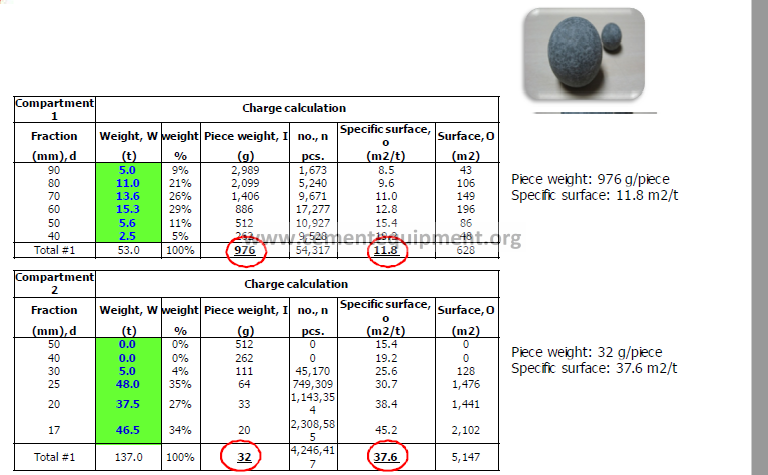
Ball charge composition
-General we use (Product Blaine 4,500 cm2/g) for “Conventional”
-Cpt.1 : Piece weight 1,500-1,600 g./piece
-Cpt 2 : Specific surface 30-35 m2/t
– For “Pre-grinding system” “R/P + Conventional”
– Cpt.1: PW ~1,100-1200 g/pc
-Cpt.2: SS ~35-40 m2/t
**depend on product fineness!!
Maximum steel ball size (Bond equation)
B=36 x (F80)1/2 x [(SgxWi)/(100xCsxDe
1/2)]1/3
Where
-B : Maximum ball size (mm.)
-F80 : Feed material size for 80% pass (Qm)
– Wi : Bond work index (kWh/t)
– Cs : N/Nc (normally ~ 0.7-0.75)
-Sg : Specific gravity of raw material (t/m3)
– De : Effective diameter of mill (m.)
-F80 = log [(0.20) size residue(mm.)]/log(%residue)
– Example;
Given
• Feed size = 5% res. 25 mm.
• Wi = 13.0 kWh/t
• Cs = 0.7
• Sg = 3.0 t/m3
• De = 4.0 m.
• F80 = log(0.20)25/log(0.05)
• F80 = 13.4 mm.
Find : Maximum ball size
B = 36x(13.4)1/2x[(3×13)/(100×0.7×41/2)]1/3
Maximum ball size = 86 mm.
Maximum steel ball size
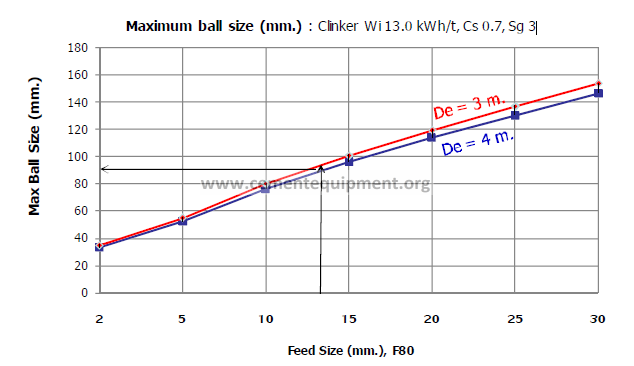
** Typical fresh clinker : 5% residue 25 mm. or F80 = 13.4 mm.
Example
– Given
• Feed size = 5% res. 20 mm.
• Wi = 12.0 kWh/t
• Cs = 0.7
• Sg = 3.0 t/m3
• De = 2.5 m.
-Find: required maximum ball size
– F80
– Maximum ball size (mm.)
Mill performance test
Steps
1. Recording of related operational data
2. Air flow measurement
3. Crash stop and visual inspection in mill
4. Sampling in mill
5. Evaluation of test
1. Recording of related operational data
-Tube Mill
. Feed rate, Return, Grinding aids, Water injection, Mill drive
power (kW)
-Static separator
Vane position
-Mill ventilation fan
. Damper position, Air flow rate (if have instrument), Pressure
.Fan drive power
2. Air flow measurement
– Air flow measurement
– Air flow rate
-Temperature
-Static pressure
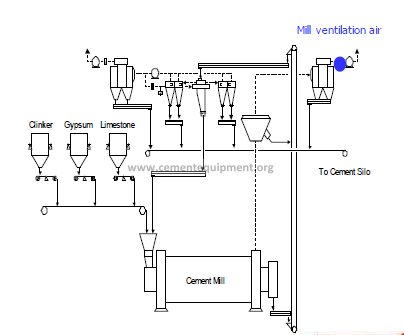

Mill ventilation air
Purpose
– Forward movement of the material –> retention time
– Take out fine particles and so diminish the risk of coating
– Cooling of the material in mill –> Diminish coating / dehydration
of gypsum
Usual ranges of ventilation:
Air speed in mill
– Open circuit : 0.8 to 1.2 m/sec
– Closed circuit : 1.2 to 1.5 m/sec
**Min 0.5 m/s —> tend to result inefficient over grinding and excessive
heat generation with possible coating problem.
**Max > 1.4 m/s —> drag particle out of mill before they have been sufficiency ground.
Agglomeration and ball coating
Cause:
-Temperature too high tendency of the
material forming agglomerates/coating on
grinding media and liner plates
-Grinding efficiency will be reduce
-Temperature outlet mill range 110-120 C.
Test 2
.Mill dimension
-Inside diameter 3 m.
-Degree of filling 28% in both compartment
.Mill ventilation check
-Flow 22,000 m3/h
– Check Air ventilation speed in mill ?
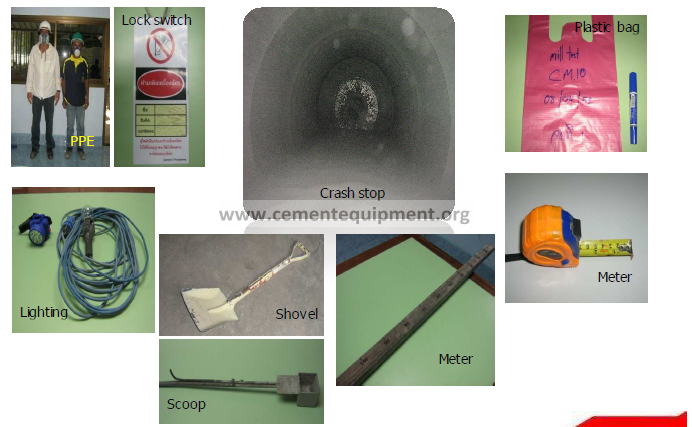
3. Crash stop and visual inspection
-Stable operation before crash stop
– Emergency stop or Crash stop
.Tube mill / All auxiliary equipment
.Mill Ventilation
– Disconnect main circuit breaker (Safety !)
-Preparation of sampling equipment (shovel, scoop, plastic bag, meter,
lighting etc.)
Preparation of sampling equipment
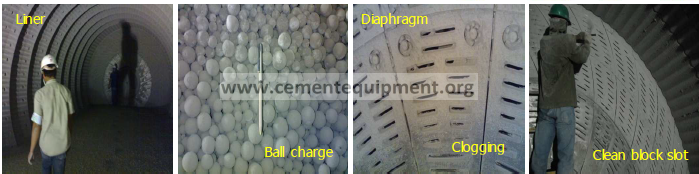
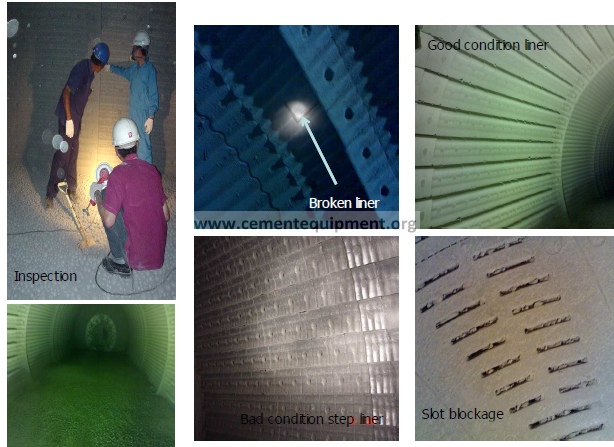
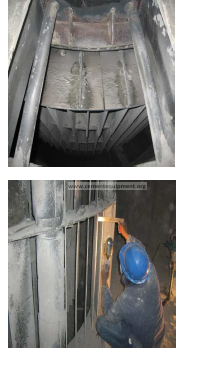
3. Crash stop and visual inspection
Visual inspection
-Liner and Diaphragm condition –> wear, block
-Ball size distribution along the mill –> classify liner
– Water spray nozzle condition —> clogging
– Foreign material ?
-Ball charge condition —> agglomeration, coating
3. Crash stop and visual inspection
-Material level in compartment #1 and #2
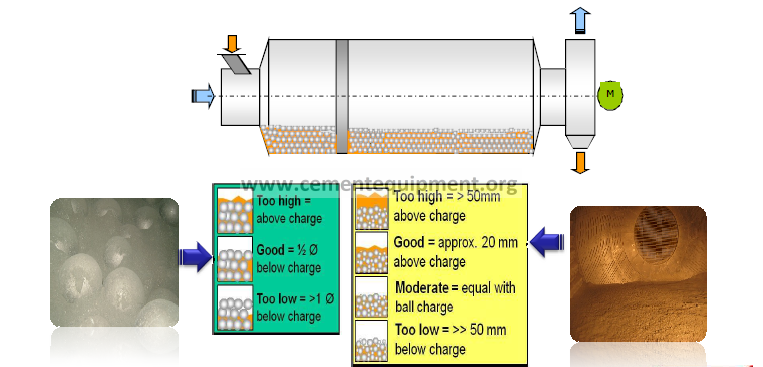
3. Crash stop and visual inspection
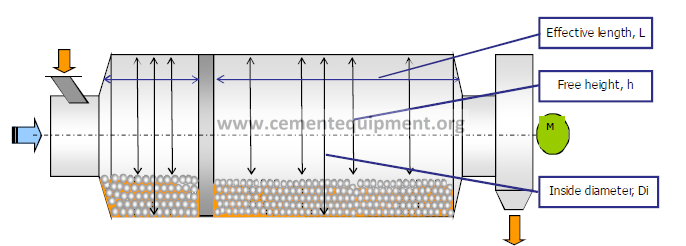
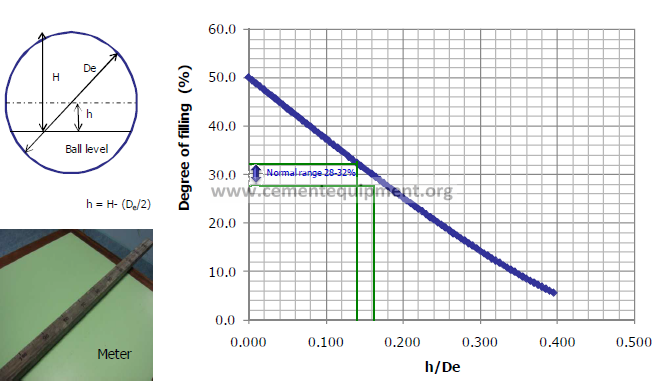
– Ball charge quantity (Filling degree)
-Measurement by free height
-Measure average internal diameter, Di
-Measure height, h, in three different points along axis for each grinding
compartment
Ball charge quantity (Filling degree)
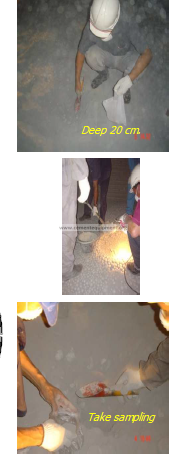
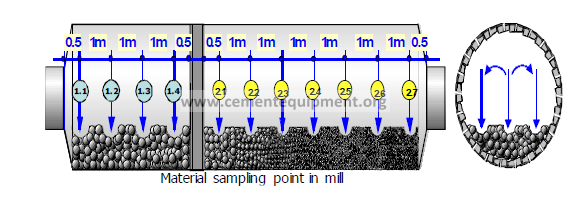
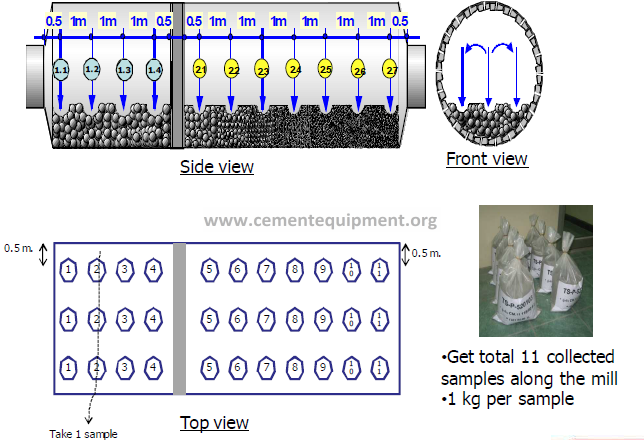
4. Sampling inside mill (mill test)
Sampling of material
– Take ~1 kg sample every 1 m along mill axis
– Each sample collected from 3 point in the same cross section
– Removed some balls and taken sample
-First and last sample in each compartment should be taken
from 0.5 m off the wall or diaphragms
4. Sampling inside mill (mill test) –cont.
– After work inside the mill
-Calculation quantity of ball charge and filling degree
-Sample sieve analysis
. 1st compartment
◊ Sieve : 16 , 10 , 6 , 2 , 1.25 , 0.5 , 0.2 mm
2nd compartment
◊ Sieve : 1.25 , 0.5 , 0.2 , 0.12 , 0.09 , 0.06 mm., Blaine Fineness
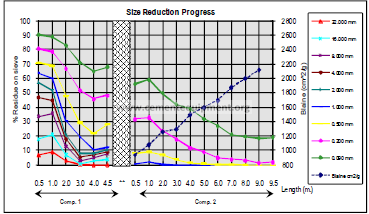
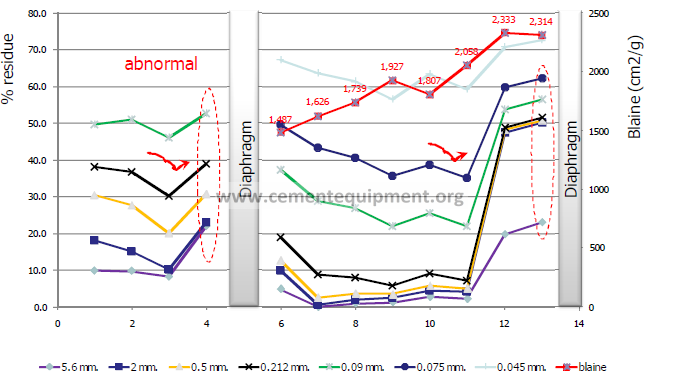
Plot size reduction chart (graph)
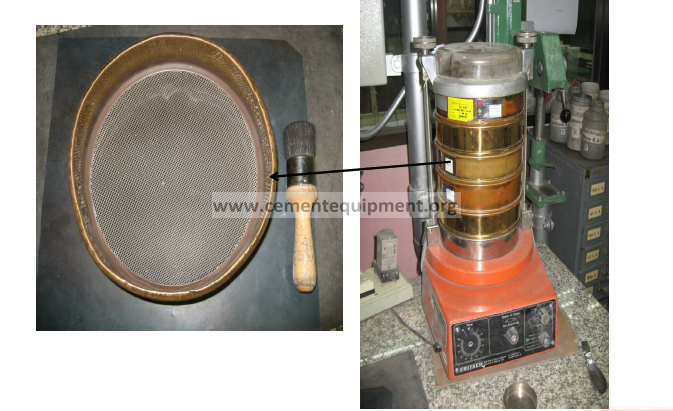
Sieve test equipment
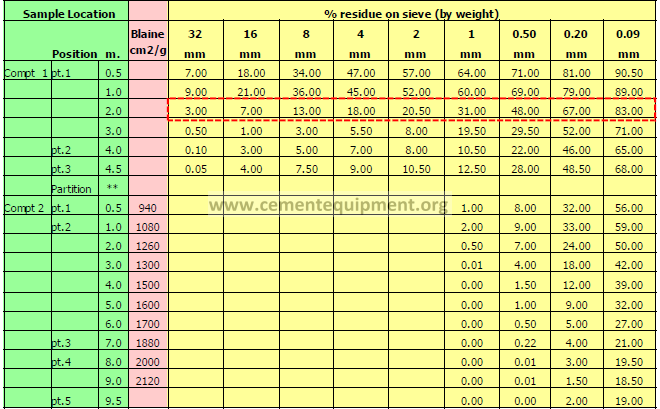
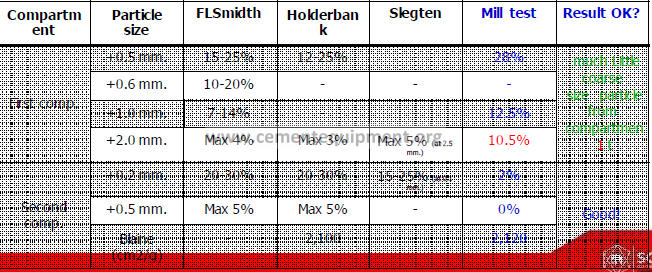
Results: Sieve and Fineness analysis from mill test
5. Evaluation of performance test
-Grinding efficiency
-Data for evaluation
-Result from visual inspection inside tube mill
-Sample analysis from longitudinal sampling inside tube mill Size
reduction graph
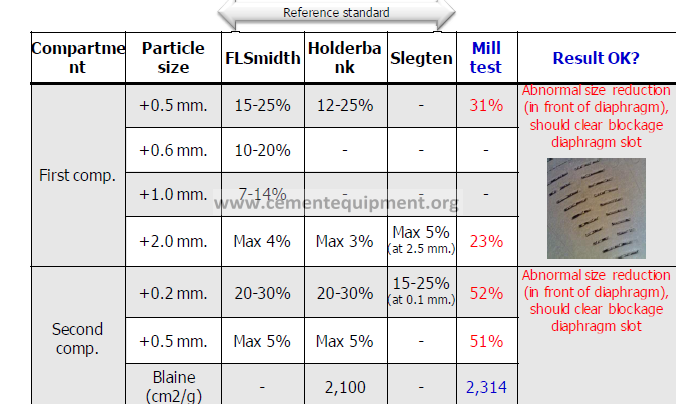
Evaluation of mill test standard reference
– Size reduction along mill axis
-Sieve residues and Blaine value in front of the diaphragms
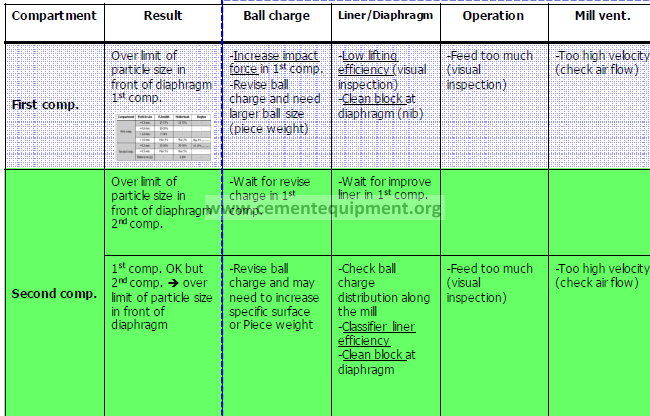
Evaluation of mill test
Evaluation of mill test
– Test result : provide information to :
– Improvement of ball charge composition
-Maximum ball size and composition
Charge composition (PW and SS)
– Modification/Replace inside grinding compartment
-Liners
-Diaphragms
– Operation
-Mill ventilation
-Clear diaphragm slot
Common problems!
Case mill test, CM6 STS (Aug,2008)
Evaluate and correction
Case Mill test from : VDZ congress 2009
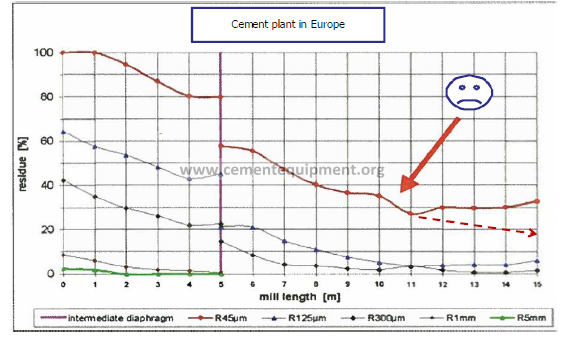
• Chamber 1 : good size reduction efficiency
• Chamber 2 : 45 micron shown results that grinding has
stopped midway through the 2nd chamber
Evaluate and correction
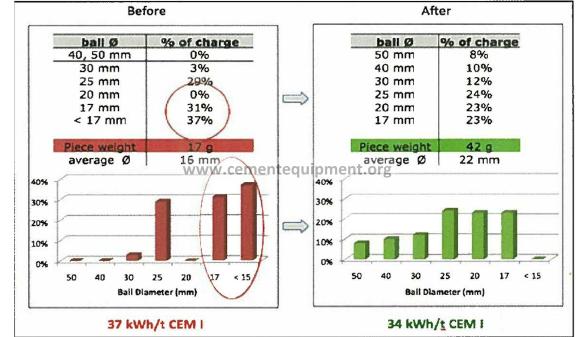
• Average ball size in chamber 2 is too small (average 16 mm, PW 17 g.)
• Take charge distribution more coarse to increase PW and average ball
size diameter (to 42 g. and 22 mm.)
Separator performance test
What is separator?
• Advantage of grinding system
with separator
• Reduce the number of fine particle to
be ground in mill
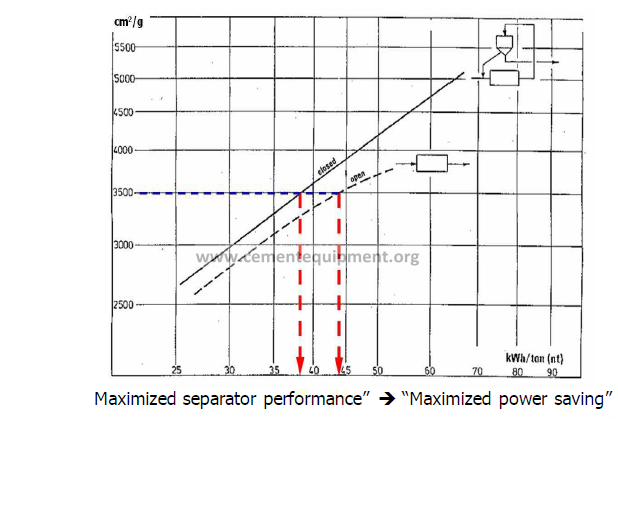
• Increase production capacity and
Reduce mill power consumption
• Increase % of Active particle in fine
particle of Cement
Advantage of grinding system with separator
Separator performance test
Steps
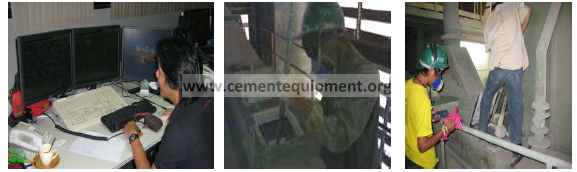
1. Recording of related operational data
2. Air flow measurement
3. Sampling within grinding system
4. Evaluation of test
– Tube Mill
Feed rate, Return, Grinding aids, Water injection, Mill drive
power (kW)
Dynamic separator
– Rotor speed, Damper/vane position
– Separator drive power (kW)
Separator circulating fan & Separator ventilation
-Flow rate (if have instrument), Damper position
– Separator fan power (kW)
2. Air flow measurement
Air flow measurement
– Air flow rate
– Temperature
– Static pressure
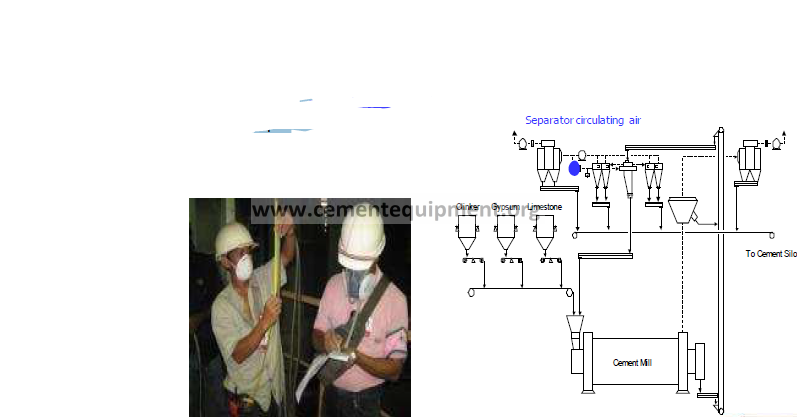
Dynamic Separator circulating air
Purpose
-Distribute and disperse cement dust
-Classify cement dust at rotor
– Take out fine particle from separator to be product
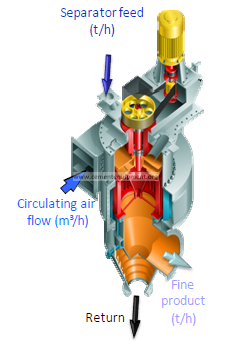
Usual ranges of circulating air
Depend on separator feed and production rate
-Separator load 1.8-2.5 kg feed / m3
* = Separator feed / Circulating air
Dust load (fine) less than 0.75-0.8 kg fine / m3
* *= Fine product / Circulating air
3. Sampling within grinding system
Operation period
-Determined suitable sampling point
– Stable operation
6-12 hours duration of performance test
-Taking samples every ~1 hour
Sampling plan (stable operation period)
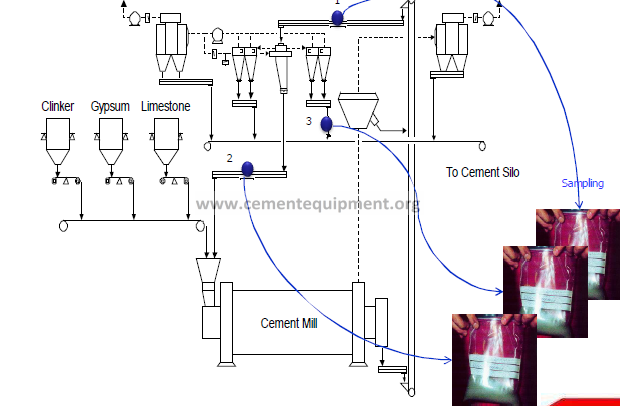
Sampling point in process
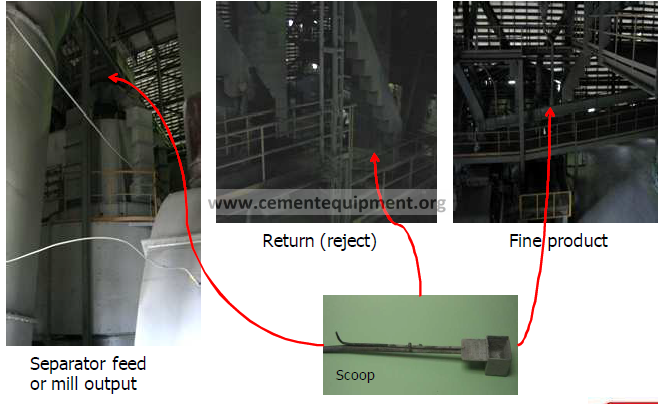
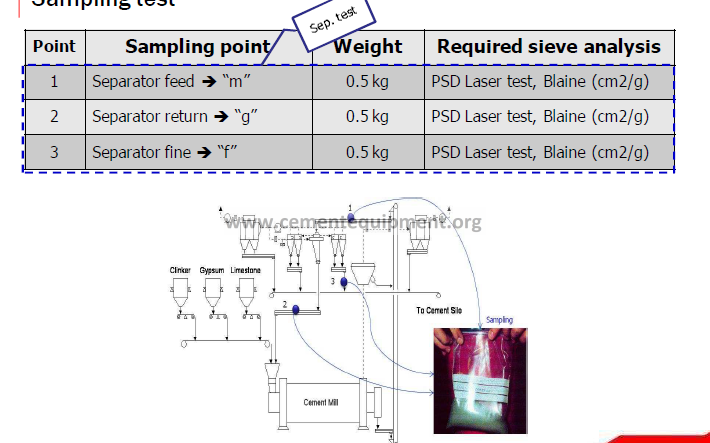
Sampling test
PSD analysis equipment
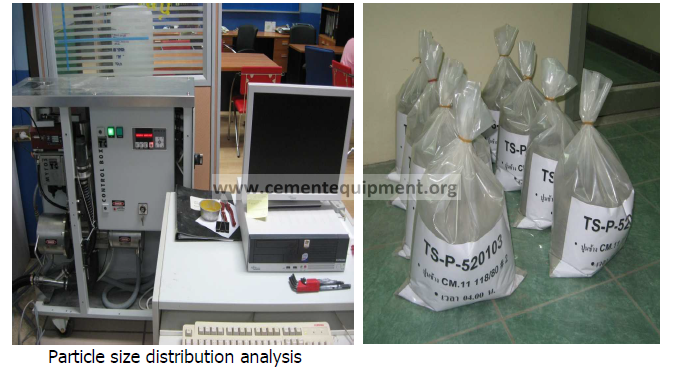
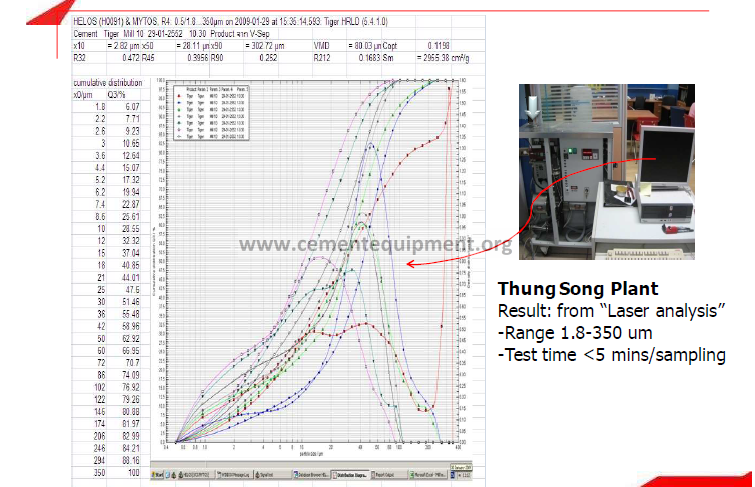
Particle Size Distribution (PSD)
-Meaning sieve size 32 um
– 52.2% of separator feed
residue on sieve size 32 um

-80.9% of reject residue on
sieve size 32 um

4. Evaluation of performance test
– Separator efficiency
Data for evaluation
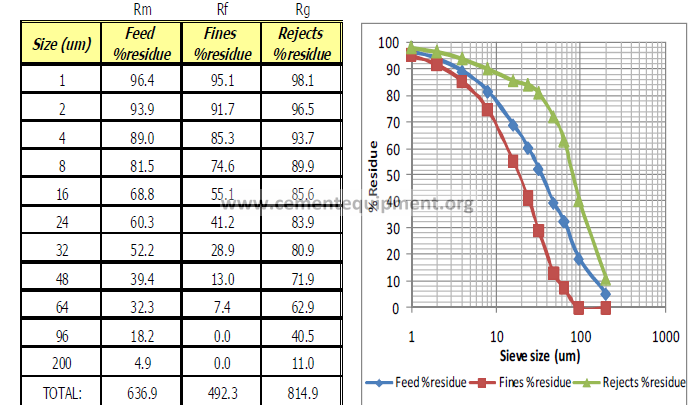
Particles size analysis of sample within grinding system
◊ – Separator feed Rm
◊ – Separator fine Rf
◊ – Separator tailing or Reject Rg
Tromp curve or Fractional recovery
The tromp curve shows what fraction of particles of different sizes in the
feed material is going in to the coarse fraction (often called Return or
Tailing)
Separator specific loads / Dust Load
Tromp curve
Calculation
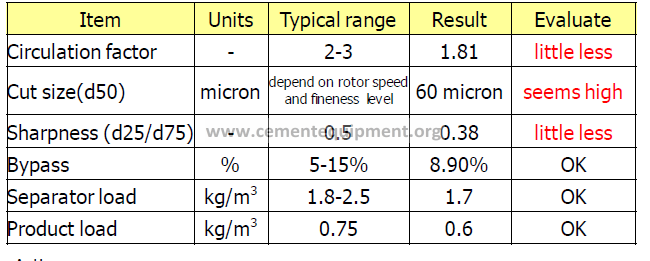
-Circulation factor (CF)
-CF = (Rf – Rg)/(Rm – Rg)
where
-Rf = % residue on sieve of fine
-Rg = % residue on sieve of coarse
-Rm = % residue on sieve of feed
In this case (size 48 um)
Circulation Factor = 1.81
Tromp curve
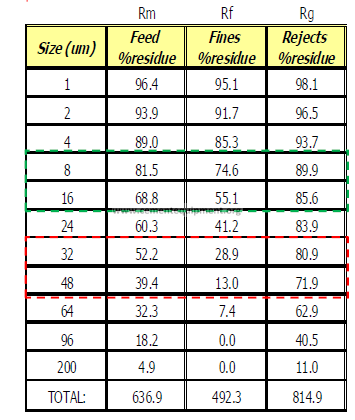
Calculation
-Tromp value
– Tromp (range d1,d2) = [(Rg1-Rg2)/(Rm1-Rm2)]x[1-(1/CF)]x100
where
-Tromp (range d1,d2) : Fraction of particles size between d1 and d2
-Rg = % residue on sieve of coarse (return/reject)
-Rm = % residue on sieve of separator feed
– In this case
-Tromp value (32-48 um) = 31.5%
Example
*Find Circulation factor (CF) of
particle size 32 um and 48 um
-CF = (Rf – Rg)/(Rm – Rg)
where
Rf = % residue on sieve of fine
Rg = % residue on sieve of coarse
Rm = % residue on sieve of feed
*Find Tromp value of size in range
32-48 um
–Tr (d1,d2)=[(Rg1-Rg2)/(Rm1-Rm2)]x[1-
(1/CF)]x100
where
Tromp (range d1,d2) : Fraction of particles size
between d1 and d2
Rg= % residue on sieve of coarse (return/reject)
Rm = % residue on sieve of separator feed
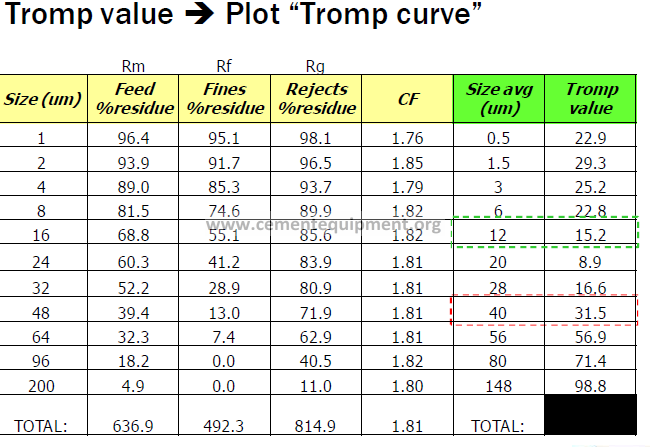
Plot “Tromp curve”
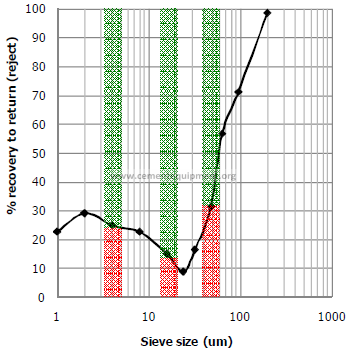
Particle size in range 32-48 um
-31.5% go to be “Return”
-68.5% go to be “Fine product”
Particle size in range 8-16 um
-15.2% go to be “Return”
-84.8% go to be “Fine product”
Particle size in range 2-4 um
-25.2% go to be “Return”
-74.8% go to be “Fine product”
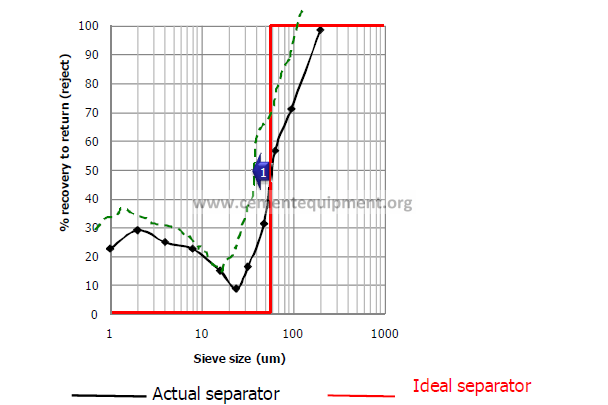
Tromp curve of “Ideal and Actual separator
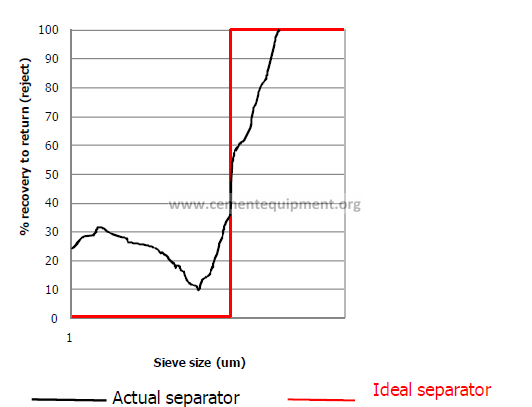
Ideal separator
No coarse in product and No fine in
return/reject
Actual separator
Have some coarse in product and Have
some fine in return/reject
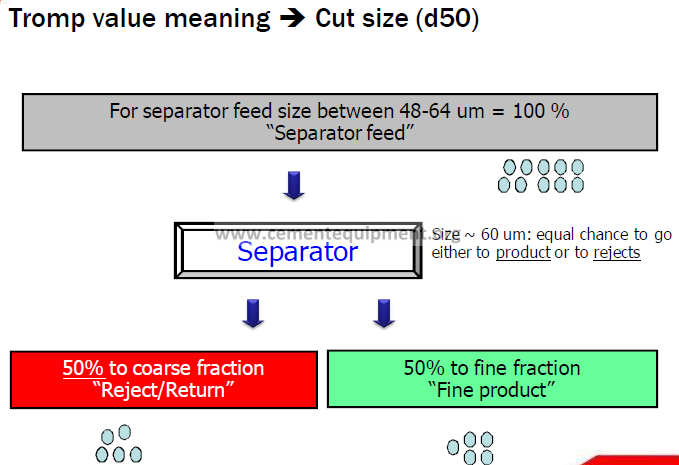
Tromp curve
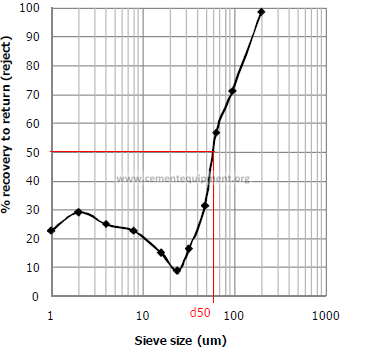
Cut size : d50 = 60 um
•The cut size of the separation
being made is the particle size
where the tromp value is 50%
•Meaning : Size 60 um has an
equal chance to go either to
product or to rejects
Tromp curve
Bypass = 8.9%
•Meaning : Bypass is an
indication of the amount of
material that essentially
bypasses the separator.
•The lower the bypass, the more
efficiency the separation.
•3rd generation bypass < 15%
Evaluation of separator performance test
Action :
1. Increase circulation factor (CF) Separator load has available
2. Need to increase speed of rotor (due to higher CF coarser separator feed)
3. Tromp curve move to finer side and d50 change to be less than 60 um.
4. Bypass slightly increase
5. Power consumption of mill went down.
Improvement Tromp curve
2. Improve production rate: Reduce
%bypass
-Improve separator feed distribution
-Check separator load and dust load ?
-Separator ventilation flow
-Check mechanical seal or leak
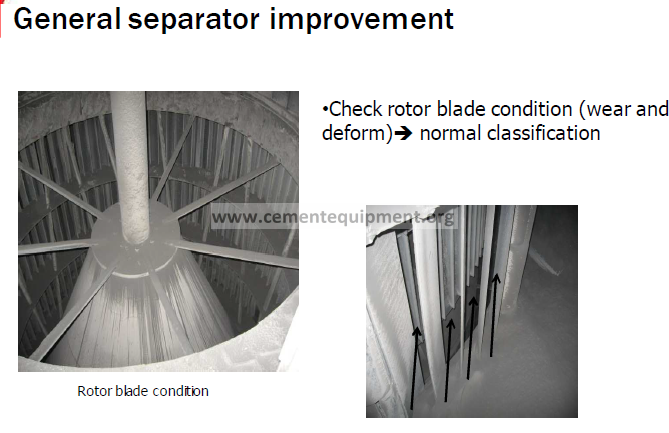
-Check guide vane and rotor blade ?
Result:
-Increase production rate
-Reduce power consumption
Test result : provide information to :
Adjustment of separator settings
Circulation load
Separating air flow, fan speed ,etc
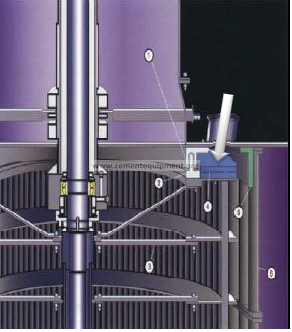
Modification inside separator
Mechanical adjustment ,etc
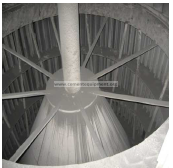
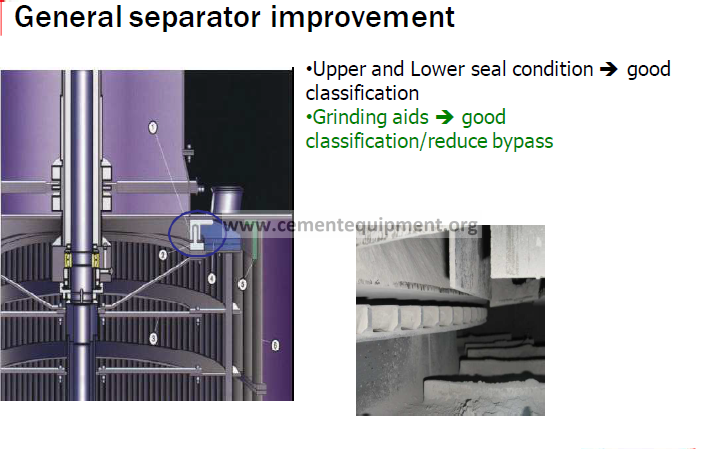
Mechanical seal
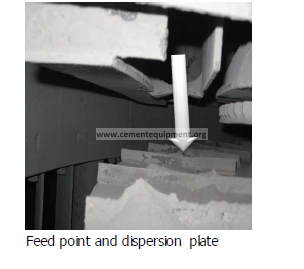
Dispersion plate
Guide vane and rotor
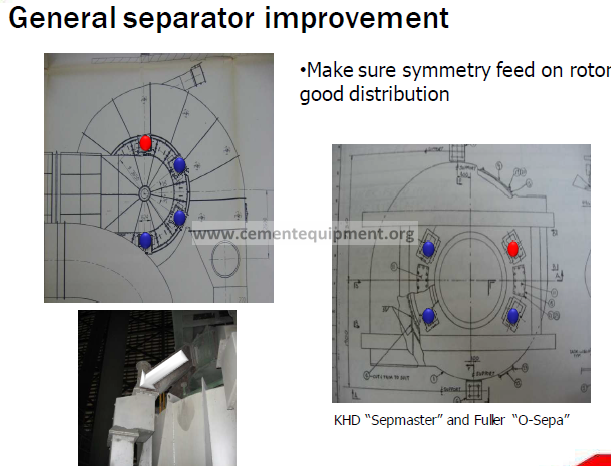
General separator improvement
•Separator feed chute
o 100% feed on dispersion plate
(over the rotor) –> good distribution
Q & A
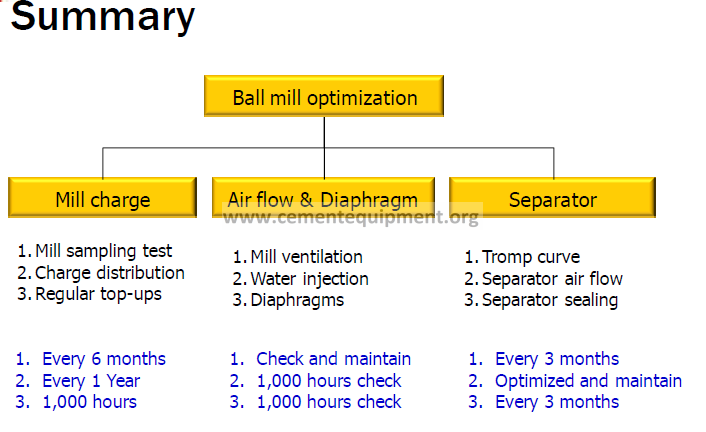
Performance test
Mill test and Separator test
Evaluation
Visual inspection
Size reduction graph and Tromp curve
Improvement
Charge composition, Operation, ect.
Results
Energy saving, Quality improvement
Premium technical shortcut This package is built for engineers, plant teams, buyers, and decision-makers who need faster access to high-value cement industry references. The material value is positioned at more than $50,000, but the package is offered at $249. If you are researching this topic because of an active plant issue, project, or supplier discussion, use the package for technical depth or request direct business support.Need organized cement references instead of scattered files?
Very nice