Contents
Everything you need to know about Analytical Techniques in Cement Materials Characterization
[wpecpp name=”package” price=”75″ align=”center”]
by Don Broton* and Javed I. Bhatty*
Many advances in the manufacturing process of portland cement have occurred since the original patent was issued to Joseph Aspdin in 1824, but the ability to rapidly analyze the elemental compo-sition was not readily available until much later. In 1887, LeChatelier’s doctoral thesis on the com-position of portland cement established the mineralogical conception of cement, and portland cement manufacture passed through its adolescence. Consequently, it was not until Wilhelm Conrad Roentgen discovered X-rays in 1895 and the first industrial X-ray spectrometer was available some 60 years later that rapid analysis became feasible. An unprecedented series of discoveries, all within a couple of decades of Roentgen, paved the way toward commercialized analysis using X-rays.
Current X-ray spectrometers are compact (Figure 8.1.1) and capable of analyzing dozens of elements in minutes, although analysis of eight elements (Si, Al, Fe, Ca, Mg, S, Na, K) is normally sufficient for portland cement manufacture. How remarkable it is that technology now exists to detect and quantify virtually every commonplace element in the periodic table in just a few minutes!
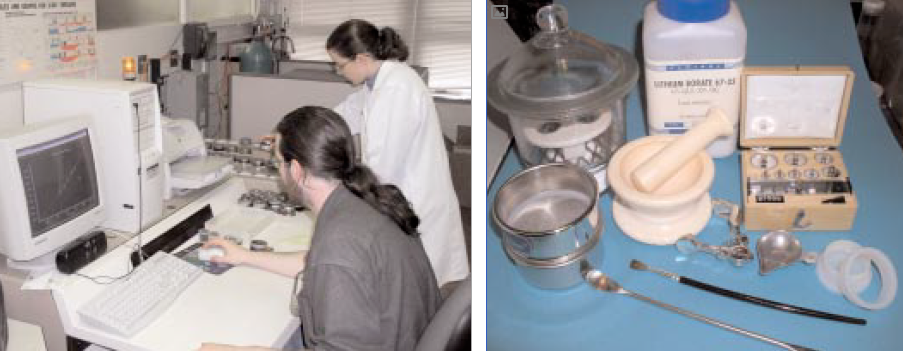
Figure 8.1.1. (left) Modern X-ray spectrometer use in cement analysis. (right) Specimen prepa-ration equipment for cement and related materials include borate flux, mortar and pestle weigh-ing dish, sieves, dessicator and the resulting specimen ready for analysis including loose powder cup, pressed powder and fused bead.
This chapter is dedicated to the development and application of X-ray fluorescence (XRF) tech-nique in cement manufacturing, but other commonly used techniques such as the classical “wet” method, and atomic absorption (AA) methods are also described.
ANALYTICAL BACKGROUND
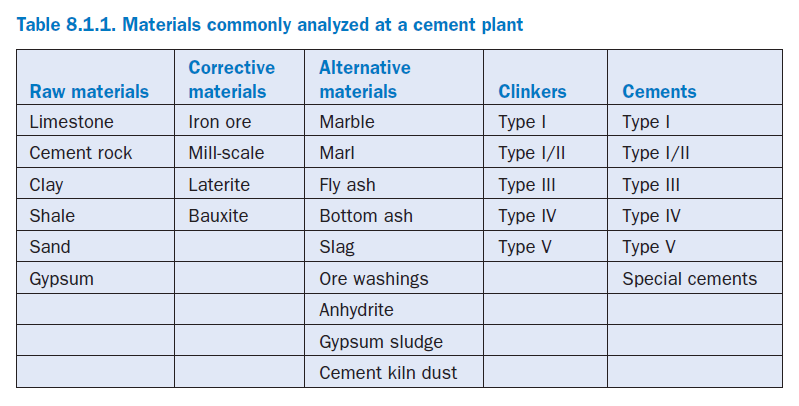
The materials routinely analyzed at a cement plant are the traditional raw materials, corrective materials, alternative materials, clinkers, and portland cements. An accurate chemical analysis of materials involved in cement manufacturing is required in order to:
• design proper cement raw mix
• acquire target clinker composition
• produce cement meeting desired specifications
An accurate analysis also helps monitor any variation in material characteristics so that a timely adjustments can be made in the raw mix formulation. Details of the commonly used materials are given in Table 8.1.1.
WHY X-RAY ANALYSIS?
X-ray spectrometers are commonplace in manufacturing today and offer many advantages over classical “wet” methods of analysis. The speed, accuracy, and precision of the instruments leapt forward with the introduction of the computer and microprocessor control. The spectrometer such as the one shown in Figure 8.1.1 are compact and available from many manufacturers. Some bench-top energy-dispersive units are not much larger than an old typewriter. The latest software packages streamline analyte line selection, select necessary interelement corrections, and make standardization virtually effortless. With the use of gearless direct-drive motors for goniometers and accurate angle sensing, precision has improved markedly. The single most challenging opera-tion now is the preparation of the specimens introduced into the spectrometer.
The physics of accurate quantitative X-ray analysis requires homogeneous, flat (planar) analytical surface. Once a specimen preparation technique is established and standardization is complete, cement chemists can rapidly analyze raw materials, clinker, and cement, with accuracy meeting the stringent performance requirements of American Society for Testing and Materials (ASTM) C 114 (ASTM 2002). It is hard to imagine today’s cement kilns producing greater than one million tons per year operating without the aid of X-ray fluorescence (XRF).
Consider comparing traditional wet methods of analysis to today’s highly efficient fusion equip-ment, multi-channel XRF spectrometers coupled with scanning goniometers and fixed diffraction channels available for determining not only the elemental composition but crystalline mineral phases such as free lime in clinker as well. Standardless analytical programs exist which require little operator input for analyzing dozens of elements automatically. The information available to cement chemists in manufacturing today makes statistical process control easy. Deming (1950) introduced statistical process control (SPC) to the Japanese after World War II. It revolutionized the quality system approach to manufacturing. Certainly, in this age of the discriminating consumer, manufacturing must be able to provide data supporting consistency and performance of any product. Cement manufacture is no exception. Hourly routine chemical and physical testing procedures ensure high quality and low variability.
The present day manufacturing process of portland cement involves, in addition to limestone and clay, the use of alternate raw materials such as bottom ash, slag, and fly ash, as well as by-products of many other industries. XRF is well suited to characterize a variety of materials, as it can qualita-tively look for elements detrimental to the cement process or product, screen these materials quickly, reliably, and cost efficiently.
Advantages of X-Ray Fluorescence (XRF) Analysis
Because a tight control of raw feed chemical composition is essential, raw materials are usually analyzed hourly to make appropriate adjustments. When wet analytical methods are used, ordinary hydrochloric acid (HCl) or nitric acid (HNO3) digestions may not be appropriate for industrial by-products, as these acids cannot completely dissolve some of them. The terms “acid-soluble” and “total” elemental analysis are not interchangeable. If accurate analyses are required, all material must be in solution, none lost to evaporation, and the total of the analysis near 100 percent. Any deviation from this goal must be investigated.
Mass balance for each compound going into a process must be accounted for in materials exiting the process. Alternate procedures using borate fusion and other more complex acids and proce-dures are necessitated, and in some cases, experienced chemists should perform the complex procedures required to safely ensure accurate results. It may take many years for a chemist to become adept at handling such chemicals and performing the procedures.
This naturally follows that if simpler, less dangerous, quicker, accurate, and reproducible tech-niques are available, the industry will adopt them quickly – and this is precisely the case for XRF analysis.
Significance of Analytical Control
Globally 1.6 billion metric tons of portland cement is produced annually, of which the United States consumes (and produces) about 100 million metric tons from about 100 cement plants. This amount of material requires the mining of almost twice this amount as limestone. Limestone, the predominant component of portland cement raw feed, loses about 40% of its weight due to CO2 evolution during the burning process. The limestone, clay, iron ore, coal, fly ash, gypsum, and vari-ous other raw components each are analyzed many times during the day to properly monitor and adjust raw feed and cement compositions.
During normal operations, the plant runs smoothly; however, if raw ingredient composition is incorrectly analyzed, the entire production process may be negatively impacted. Changing the chemistry of the raw feed may affect burnability, grinding efficiencies, or heat profiles, and kiln and pre-heater build-up may produce blockages. If the kiln is shut down, the refractory lining may suffer damage and relining may become necessary. All are detrimental to the process and produc-tion. With proper equipment, training, and diligence, plants can run as efficiently as possible with each process optimized; from raw materials selection and proportioning, to grinding and clinker-ing, and finally, to finish milling, storage, and shipping.Statistical process control charts, plotting all within the limits set, create optimum conditions for maximum production and high quality product.
Material Sampling
Proper sampling (and testing) of the product is necessary but at times, it is overlooked or misun-derstood. It is frequently asked how many samples are taken and how many of those are composited for testing. A “mill certification” showing the chemical composition and physical properties according to ASTM C 150 is supplied with each shipment and may be a monthly composite of many analyses. Can anyone tell the variability in a product when a 5 kg composite is analyzed out of every 60,000 metric tons delivered? Is one composite from an entire shipment adequate to determine compliance with current specifications? Many if not most cement plants are able to provide statistical process control data ensuring the purchaser of low variability. How often the final product is tested may be dependent on the purchasers’ demands for assurance that they are obtaining product meeting a specific chemical and/or performance specification.
Because portland cement is hygroscopic, any sample taken should be placed into a moisture-proof container, properly labeled, and kept sealed until tested. Sampling from a barrel of cement will typically involve the use of a sample thief. (see Figure 8.1.2). ASTM C 183 “Standard Practice for Sampling and the Amount of Testing of Hydraulic Cement” can be used as a guide for adequate testing (ASTM 2002). A good discussion of sampling and testing cement is found in ACI 225.1R.
In most cases, a single determination of the chemical and physical properties is used for accept-ance. However, the possibility of borderline cases must be considered is with respect to acceptance. How many samples must be analyzed if a discrepancy exists? Who will be the referee-testing labo-ratory and how will the results be applied to the shipment? Referee laboratories may be required to show established credibility by participation in reference sample and laboratory inspection programs of the ASTM-sponsored Cement and Concrete Reference Laboratory (CCRL).
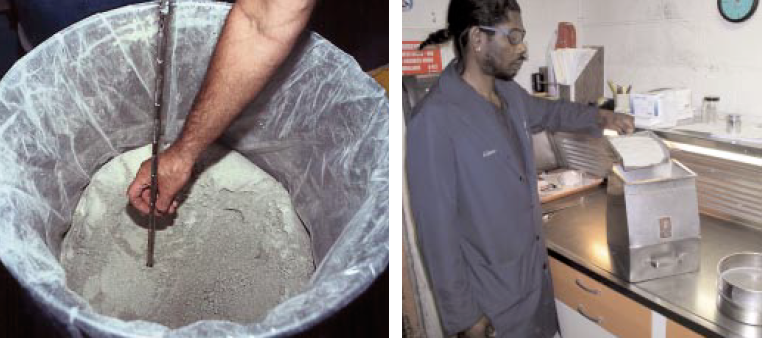
Figure 8.1.2. Use of a sample thief is recommended when sampling from a bulk container. Open the thief lengthwise on a clean paper to view the sample throughout its depth. A riffle-splitter is used to reduce samples to laboratory size.
What will happen if a contamination is found? Variations may exist between laboratories and the causes must be determined. The National Bureau of Standards (currently NIST) dedicated a specific publication, “Causes of Variation in Chemical and Physical Tests of Portland Cement,” to this topic (Bean, 1961). Ships, tankers, etc. also move other materials as well as cement and unless the holds and tankers are completely emptied of these materials, contamination may result. How much contamination was found in this shipment? How do you find small amounts in 50,000 metric tons of material? How much contamination will result in altered physical properties of the cement during use? A significant amount of random sampling and testing is costly and time consuming. In any case, careful observation of loading and unloading coupled with good sampling practices, a well-defined sampling plan, and high quality testing will usually minimize most of these concerns.
Many if not most building codes will require a cement that meets specification such as ASTM C 150, ASTM C 595, ASTM C 1157, AASHTO M 85, EN 197, etc. The ASTM specification cites ASTM C 183 as the standard procedure for acceptance sampling and testing. The significance of data supplied on a mill test report should be evaluated on its representation of the cement being shipped. Some mill reports can be monthly composites; some represent material in a specific silo, sampled as it was being filled. Some may be representative of a series of grab samples or a compos-ite of those grab samples collected from transfer from bulk shipment. From ships, they may be collected from each hold, then composited for testing. Each individual sample should be retained as well as a composite made from sub-samples of each grab if a single composite sample is to be tested. This way if discrepancies occur, each individual sample may be tested to fully evaluate how much material meets specification.
Sampling procedures from any final product stream should be specifically outlined in detail to eliminate any concerns from either purchaser or supplier. Laboratories involved in testing product should be well qualified and specified prior to shipment. Samples should be shipped in sealed containers and testing commenced in appropriate time frames. The cost of good testing and qual-ity control of cement is small when compared to testing and evaluation of failed concrete, its removal, and replacement.
X-RAY FLUORESCENCE (XRF) TECHNIQUE
The Fundamentals
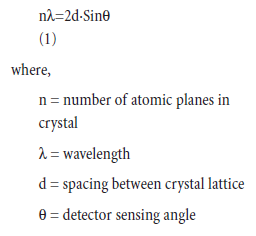
X-ray analysis utilizes electromagnetic radiation of wavelengths from about 0.1Å to about 20 Ångstroms. These x-rays are produced by a deceleration of electrons and/or electron transitions in the inner orbits of atoms. An x-ray tube produces the necessary wavelengths by accelerating elec-trons from an emitting source (the filament) toward the target material. This high-energy collision yields a significant amount of heat. Only about 1% of the energy used to produce x-rays is converted to x-rays; the other 99% is converted to heat. When an electron decelerates after hitting the target, the electron gives up its energy stepwise, which gives rise to a continuum. The contin-uum provides the principle source of specimen excitation. Once the specimen is bombarded with x-rays, electrons are ejected from their inner orbitals of its atoms and electrons from outer orbitals fall into the vacancies. With this transition, there is an energy loss, which appears as an x-ray photon. Photons of all energies associated with the elements in the specimen emit in all directions but only a small amount are actually detected. These photons are collected at discrete angles through collimators and diffracted off crystals to effectively screen out all unwanted photons. The photons then are detected as pulses in the electronics with the magnitude of the pulse height proportional to the energy of the incoming photon. Bragg’s equation, given below, describes the relationship between the energy of the incident photon and its relation to a diffraction crystal’s inter-lattice (d) spacing and detector sensing angle.
A schematic diagram of different components in an x-ray spectrometer is shown in Figure 8.1.3
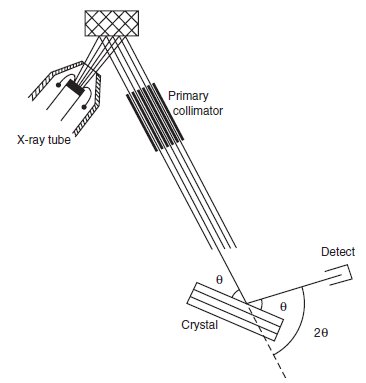
Figure 8.1.3. Schematic diagram of a wavelength dispersive X-ray spectrometer components including X-ray tube, specimen, primary collimator, diffracting crystal, angle θ, and detector. (Drawing courtesy of Kanare)
XRF Specimen Preparation
A number of methods for preparing specimen for X-ray fluores-cence (XRF) analysis are available, and are presented in order of complexity below:
1. simply and creatively mounting
the specimen in the holder, unadulterated,
2. loose-packing powders into cups and covering with thin films,
3. grinding samples to a fine powder and pressing it into a briquette, or
4. weighing proportional amounts of sample and flux for fusion into a glass bead.
Each method has advantages and disadvantages which include such things as accuracy, precision, volatility, particle size, and mineralogy effects.
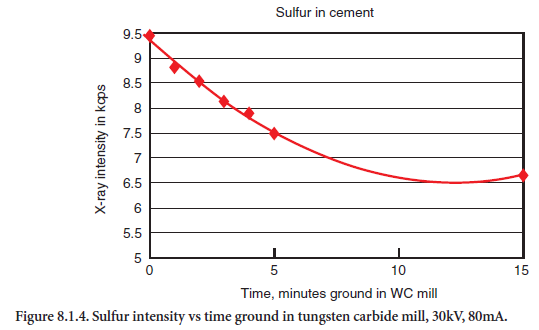
Analysis of sulfur in fine, glassy fly ashes may yield acceptable results using loose packed powders under thin films. Pressed powders of fly ash samples can be problematic. If the briquette breaks apart and deposits on the X-ray tube, it can take hours to clean, reassemble, and restabilize the equipment. Briquettes also bring mineralogical and particle size effects into the error equation. The glassy nature of fly ash requires significant amounts of binder to hold the specimen together. Grinding time must be exact. Sulfur and potassium seem most affected by grinding time. Longer grinds show lower concentration, see Figure 8.1.4.
Fused beads eliminate those problems but may create others, which can also lead to inaccurate results. The fusion, completed at high temperature, may evaporate halogens, sulfur, alkalies, and other volatile elements. Because of this, some analysts select classical wet methods or pressed powders. Showing the linearity of calibration graphs and low standard error of estimates of these elements in cement using fusion and XRF analysis under proper time, temperature, and analytical conditions will usually convince even the most skeptical “wet” bench chemist.
Routinely, two specimen preparation techniques are employed; they are: pressed powdered briquette and fused bead techniques. Occasionally, though, loose pack powder, and simple mount-ing of specimen on sample holder are also utilized. This method can quickly indicate the presence and relative amounts of an element in question. A brief outline of these methods is give below.
Pressed powder briquettes. Normally considered the fastest and easiest of the XRF prepara-tion techniques, pressed powdered specimens are reliable in many cases. Techniques vary little among users with most using a tungsten carbide (WC) ring and puck mill to grind the sample. In less than four minutes, using one or two drops of propylene glycol as a grinding aid, the WC mill will reduce portland cement particle size to 90% less than 10 µm with a mass median diameter of about 5 µm. What varies among users is the type and amount of grinding aids and binders and the grinding time. Ordinary portland cements may show little variance in composition when prepared using any of the commercially available binders; however, raw feed varies considerably with the geological make-up of the samples. Some are simple clay and limestone blends passing through a wet kiln process. Ask a cement chemist who had to control the composition of one of these opera-tions and the chemist will tell you how easy it is to be a plant chemist. Move the cement chemist to another location, with a four-stage preheater-precalciner process using several by-product raw materials, and the chemist has quite a different perception. The configuration of the x-ray tube should be considered when selecting the specimen preparation method. If the sample is inverted over an x-ray tube, binders may be essential to prevent powder deposition on the x-ray tube. However, if the tube is located above the specimen no binder may be necessary.
Binders are available commercially and may be as simple as an ordinary 250 mg aspirin tablet (Figure 8.1.5). Binders hold the speci-men together and minimize dust contaminat-ing the spectrometer and x-ray tube. Grinding and binding seem counter produc-tive to each other in a single operation, and it is unlikely that both processes are achieved effectively and simultaneously on all material types. More appropriately, a two-step method can be utilized to prepare powder specimens. Propylene glycol, when used as the grinding aid, is first placed in the WC mill for particle
size reduction. Then binder is added and ground for an additional minute to hold the specimen together. Another grinding aid, Vertrel XF®, and the use of hardened steel ring and puck mill, has been shown effective in reducing particle size as well (Anzelmo, 2001). Careful attention to grinding time is necessary to prevent varied results in samples.
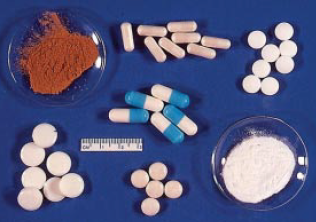
Figure 8.1.5. Commercially available binders come in capsule, tablet, and powder forms.
Once the sample is ground, placed into a die assembly (Figure 8.1.6), and pressed using 50,000 lbs of pressure (25 tons), a stable, rugged specimen is produced. An automatic press can control the process in three stages: loading time, dwell or hold time, and release time. Pressed powder briquettes are generally considered perfectly suited for process control. However, multi-mineral raw mix components are not ground with the same efficiencies as portland cement clinker and cannot be expected to produce similar particle size distributions using identical procedures.
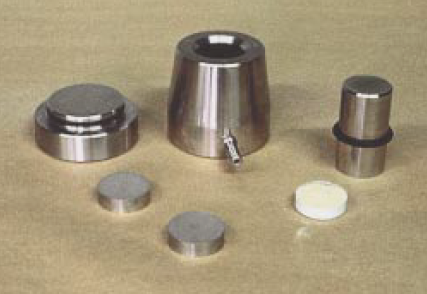
Figure 8.1.6. Disassembled briquette press and aluminum samples caps. Pellet producing the finished surface of the briquette should be highly polished and free from scratches.
Raw mixes that contain significant amounts of quartz as a silicon source may result in poor analytical results for silicon as limestone and quartz have significantly different hardnesses as measured by the Mohs scale. Similarly, blended portland cements that contain fly ash, slag, or silica fume may have analytical errors as well, for the same reason. Because of the above errors, fused bead preparation may be utilized as the specimen preparation technique as it eliminates the problematic particle size and mineralogical effects.
Fused bead preparation. Chemists are sometimes apprehensive about using the fusion tech-nique due to a variety of reasons such as complexity, time, cost, volatility, etc. Once an analyst sees the benefits of improved standardization accuracy using fused beads, most likely he or she will not want to return to pressed powders. Using fusion as a preparation technique virtually eliminates mineralogical and particle size effects. The only corrections left are small inter-element correc-tions, but at this point pure x-ray physics and counting statistics dictate accuracy and precision. The only area an analyst needs to address is proper fusion technique. Fusion time and temperature are critical, as certain elements may evaporate in the high temperature environment.
Fusions can be performed in a conven-tional muffle furnace or by use of commercial fusion apparatus (Figure 8.1.7). Commercial devices use flame (propane/air), resistive heating, or induc-tively coupled heating to melt the flux, dissolve the sample mixture, and form glass beads. The unit secures both the crucible and mold and automatically rotates to mix and cast the specimen. Units are available that can fabricate up to six specimens at a time.
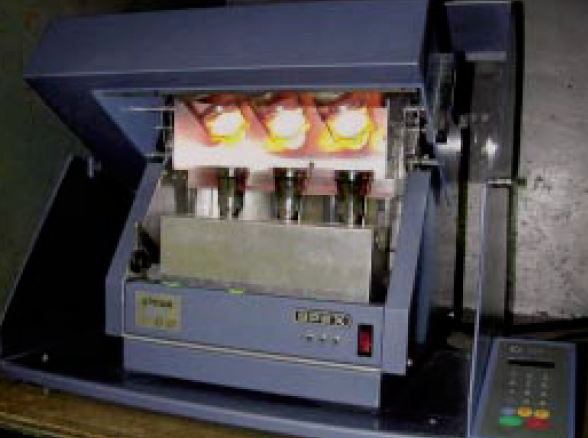
Figure 8.1.7. A three place Claisse® flame unit in oper-ation. Temperature, time, and cooling are all impor-tant for fabricating good quality fusion glass beads.
Samples of cement are ignited at 950°C to obtain the loss on ignition (LOI). This can be done in an ordinary muffle furnace or in a multi-position thermogravimetric analyzer (TGA). Automated TGAs can hold up to 19 samples and can be programmed to determine the losses at various temperatures (Figure 8.1.8). This is useful for blended cement analysis.
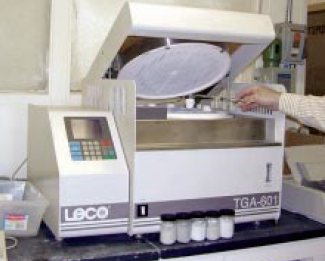
Figure 8.1.8. Multi-position thermogravimetric analyzer.
Blended cements that contain limestone can be analyzed for loss between 550°C and 950°C (CO2) and then the value used to calculate CaCO3 content. Ordinary geological materials ground to pass a 150 mm sieve can be fused in as little as three minutes with flux temperatures less than 1000°C. The walls of the crucible in contact with the flux exceed 1100°C when measured with a Type S thermocouple. If the thermocouple is placed in the center of the mass of molten flux/sample, the temperature measures about 950°C. It is difficult to determine the exact temperature in a crucible of a flame unit, as the sample is continuously rotated or agitated. The process must be stopped to make temperature measurements. The molten material has much more time in contact with the hot flame through the crucible wall when stopped and will yield higher temperatures. Some cooling takes place as the crucible areas move in and out of contact with the flame. Units that use electrothermal heating and close temperature control are continuously monitored. This method is usually a “one at a time,” process unlike flame units that can fuse one to six samples per run.
Many different fluxes are available to the analyst, each having a particular use to dissolve material completely. The fluxes most widely used by cement plant personnel are either pure lithium tetra-borate or a lithium tetraborate-metaborate blend. Pure lithium tetraborate is useful for most of the geological materials used in the cement industry but has difficulty fusing, without recrystalliza-tion, high silicon and aluminum materials such as sand, silica fume, or alumina dross by-products. Using a mixture of 67% lithium-tetraborate and 33% lithium-metaborate practically ensures all samples will fuse easily without recrystallization.
In each case of flux selection, two parameters should be checked: flux loss on ignition and contamina-tion. These are easily done using whatever fusion device is available. By fusing a blank disk, both param-eters can be monitored. The fusion blank or borate flux should yield an optically clear disk, which can be scanned in the x-ray spectrometer for contaminants. The weight of the flux should be measured prior to fusion and after to determine the loss on fusion. Some fused material may stay attached to the inside of the crucible, which must be included in the mass of the disk for calculating an LOI.
Example calculation:
If 7 grams are needed for fabricating a 31 mm disk at a dilution of 5:1, then the formula is given as: Sample mass = 7 grams total mass ÷ (5+1 dilution).
The amount of ignited sample to use is thus 1.1667 and 5 times that mass or 5.8333 grams of ignited flux are used. If the flux has an LOI of 0.5%, then 100/(100-0.5)*5.8333 gives the LOI corrected flux to use which is 5.8626 g. If 1.1667 grams of ignited sample is used with 5.8333 grams of ignited flux (or loss on ignition corrected flux), the disk after fusion should weigh exactly 7 grams.
A quick check to determine loss on fusion is to fuse a glass bead of anhydrite (CaSO4) with the chosen flux. Calculate the loss on fusion. This weight loss, if any, will determine whether the proper time and temperature is used because sulfur will evaporate if excessive temperature or time is used (Broton, 1999) (Kocman). Once calibration standards are fused, the same source or supplier of flux should be used for unknowns as well. For the fusion process, 95% platinum / 5% gold crucibles and molds are used and if cared for properly can last many years. Boiling in a dilute acid (1 HCl + 10 water) easily cleans any residue that may be left in the crucible or on the mold. This cleaning solution should be made fresh weekly and labeled accordingly for cleaning of the plat-inum. Never mix nitric acid and hydrochloric acids, which will dissolve the platinum. If molds become convex or concave they can be reshaped, or the specimens can be ground flat using a 30 mm diamond wheel with water as a lubricant. Suppliers of platinumware may also provide a service to clean, polish and reshape platinum.
Non-wetting agents are used to facilitate release of the glass bead from the mold. If too much is used the molten glass may not fill the mold as the glass pulls away from the walls of the mold and beads like a water droplet on glass. If too little is used the glass will stick to the mold and crack when cooled. If too low a fusion temperature, coarse material, or wrong flux is used, inclusions and cracking result. (Figure 8.1.9).
A typical and widely used releasing agent is lithium bromide. For 2:1 sample: flux dilutions and seven grams of total material, one drop (25 µL) of release agent (a saturated solution of lithium bromide, diluted 1:1 with water) is normally sufficient. When the fusion is complete, the speci-men should release easily from the mold and very little material should be left in the crucible. Care should be exer-cised to insure the same amount is added to calibration standards and speAcimens. Prior to analysis, a careful inspec-tion of each fused bead is carried out to ensure that the specimens are free of inclusions, interior bubbles, or swirls of unfused material (Figure 8.1.10). Glass specimens may also be ground flat using a diamond-impregnated metal wheel with deionized water as a lubricant to ensure flatness.

Figure 8.1.9. A fused bead showing cracks due to incomplete dissolution.

Figure 8.1.10. Fused bead specimen showing inclusions and interior bubbles.
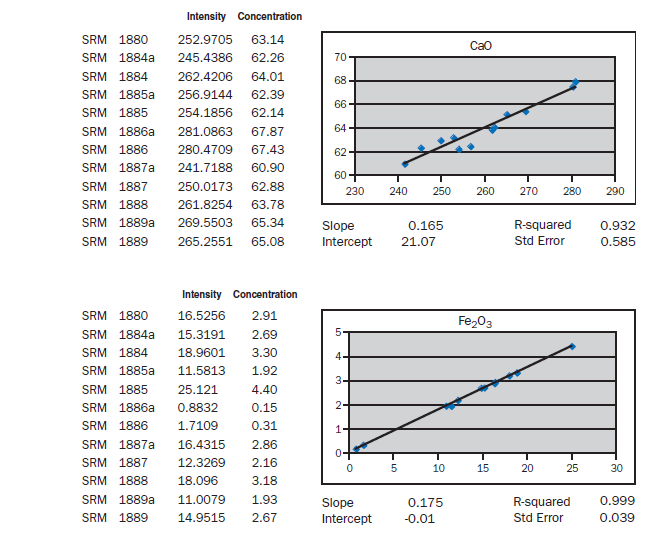
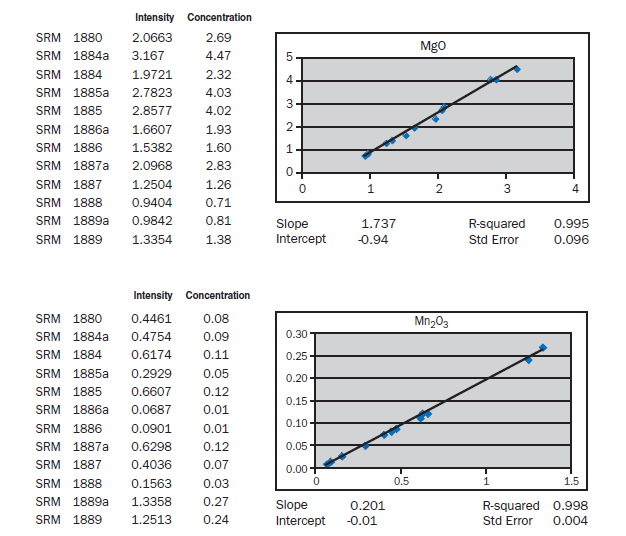
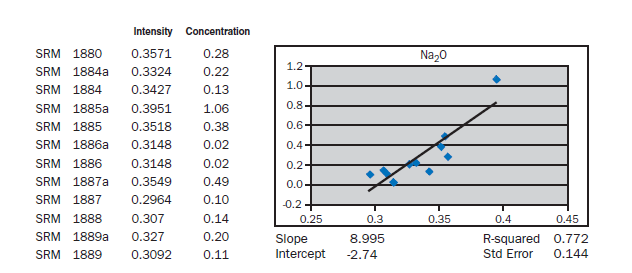
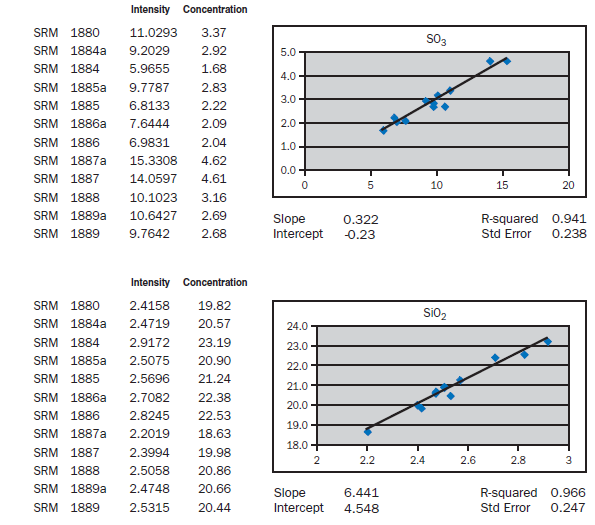
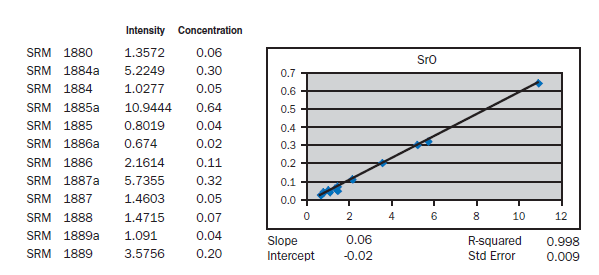
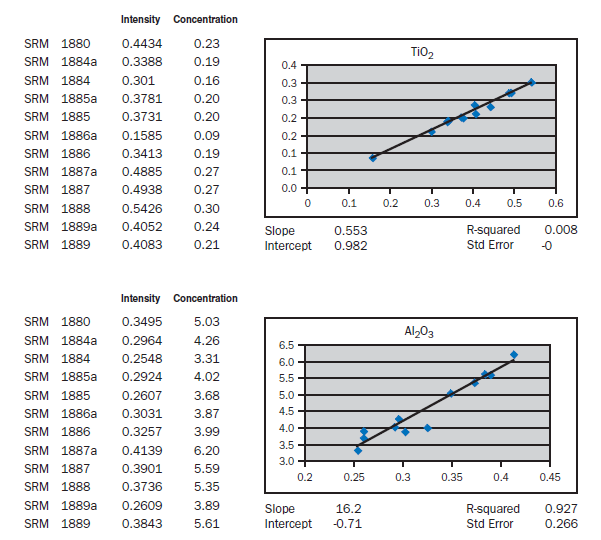
Loose pack powder (No-prep X-ray analysis). If samples of cement were placed in the spectrometer without any special specimen preparation, without interelement corrections, what accuracy is achievable? The graphs in Appendix A represent a selection of 12 NIST Standard reference Materials (SRMs) placed in powder cups (loose
pack powders), covered with 6 µm Mylar® film and placed in a wavelength dispersive, scanning spectrometer at 30 kV and 80 mA. For most of the elements, meeting the requirements of ASTM C114 would not be much of a problem. Silicon, aluminum, calcium, and sulfur show standard errors about twice the values required for qualification of the test method. What is remarkable is that the prep time is about 30 seconds. Deviations from the line can be attributed to particle size, mineralogy, incon-sistent packing of the powder (porosity), critical thickness (for sodium), and lack of interelement corrections. Equipment necessary for loose powder preparation is shown in Figure 8.1.11.
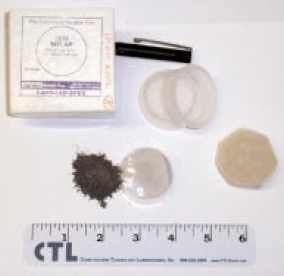
Figure 8.1.11. Loose powder preparation equipment.
The reader is encouraged to evaluate the different specimen preparation techniques available, the time and materials required, and the necessary accuracy for reported values.
STANDARDIZATION OF XRF ANALYSIS
Several standards are available to monitor quality assurance and certification of XRF equipment performance and accuracy. A brief description of select materials is given below:
Standard Reference Materials
A number of Certified Reference Materials (CRMs) and Reference Materials (RMs) are available from many sources. The definitions for CRM and RM as listed in the International Organization for Standardization’s ISO Guide 30:1992, “Terms and Definitions Used in Connection with Reference Materials,” are listed below.
Certified Reference Material (CRM). Reference material, accompanied by a certificate, one or more of whose property values are certified by a procedure which establishes its traceability to an accurate realization of the unit in which the property values are expressed, and for which each certified value is accompanied by an uncertainty at a stated level of confidence. CRMs are certified by a recognized certifying organization using approved certification procedures as instructed in ISO Guide 35:1989, “Certification of Reference Materials – General and Statistical Principles.” The organization is usually a function of a federal government or recognized by a federal government. A CRM is the highest level to which an analytical reference material can be elevated.
Reference Material (RM): A material substance one or more of whose property values are sufficiently homogeneous and well established to be used for the calibration of an apparatus, the assessment of a measurement method, or assigning values to materials. The RMs usually have been through interlaboratory testing using many analysts and supplied with a certificate of analysis but do not strictly follow the procedures of certification as indicated in ISO Guide 35:1989.
It is interesting to note that no cement raw mix standards exist – and for good reason. Mineralogy of the kiln feed is variable at different cement plants; some use clay and limestone and others contain quartz, fly ash, bottom ash, and many other materials. Significantly different results may result depending on the ingredients when using pressed powders in analyses. However, if the fusion technique is used, cement calibrations can be used effectively to analyze raw feed and clinker as well. Careful attention to sulfur, alkalies, and chloride is still required. Cement standards, available from NIST, vary in composition so they can be used in calibration or qualification under ASTM C 114.3. Supplies usually last 15 years or more as thousands of samples are packaged and randomly tested for homogeneity and composition to produce a Certificate of Analysis (COA).
Other reference material suppliers have one or two standards, which will add to the number of samples used for calibration, or can supplement the qualification of the test methods. Because the Cement and Concrete Reference Laboratory (CCRL) samples are analyzed by 100 laboratories or more and statistically evaluated, it is not uncommon for these samples to be used as standards in calibration work. Caution is warranted in this practice because the results are averages of many labs’ results, not “certificate values.” Nettles (1998) proposed using pure compounds formulated to mimic the composition of the 1800 series cements using the fusion technique. Other sources of reference materials can be found in Appendix E.
Drift standards. Drift standards correct for any instrumental changes such as x-ray tube aging, detector sensitivity, etc. Such drift standards should be stable materials free from changes due to exposure to x-rays and aging. Typically, drift standards are fused beads for cement. Currently avail-able are glass standards made by A.S.O. Design specifically formulated for portland cement manu-facture concentration ranges. Breitlander also supplies glass drift standards. In any case, the drift correction must be used if chemical results indicate substantial evidence that the method is not providing results in accordance with ASTM permissible limits.
Calibration Data Using NIST Portland Cement SRMs
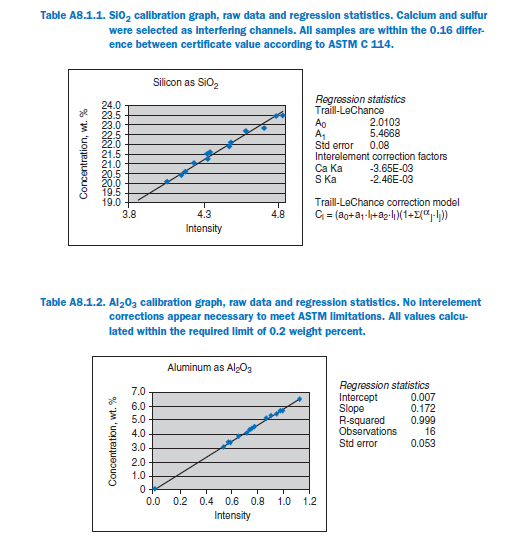
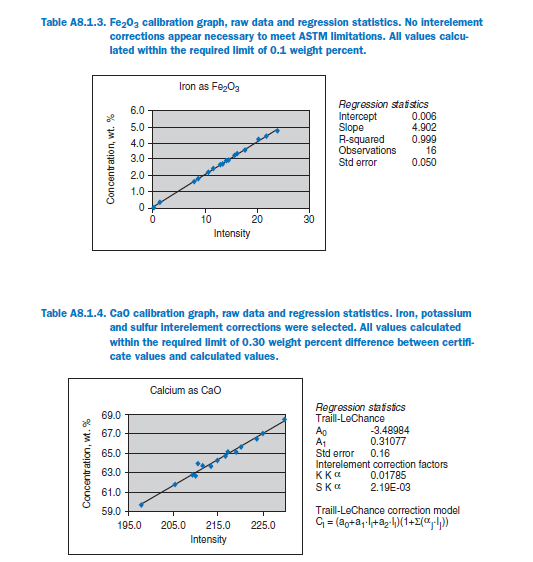
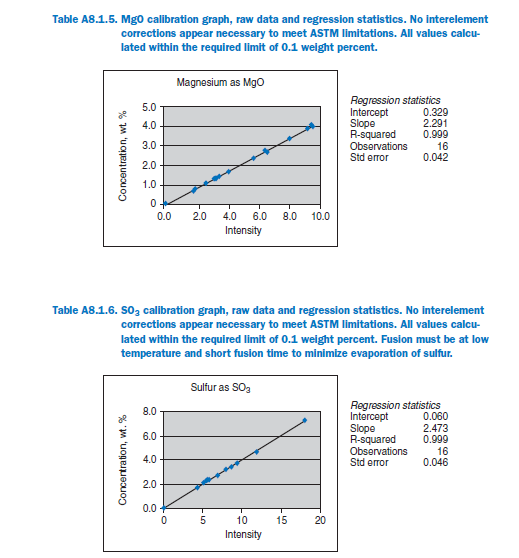
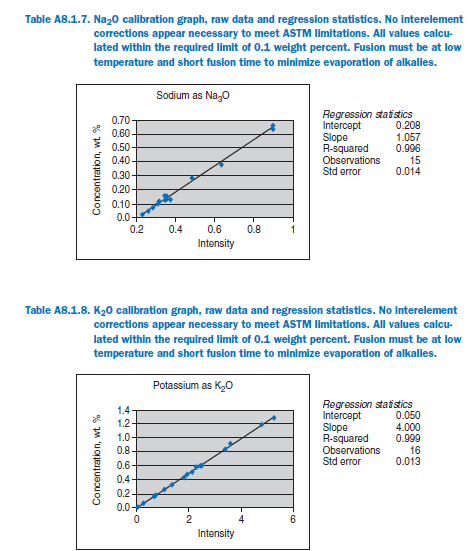
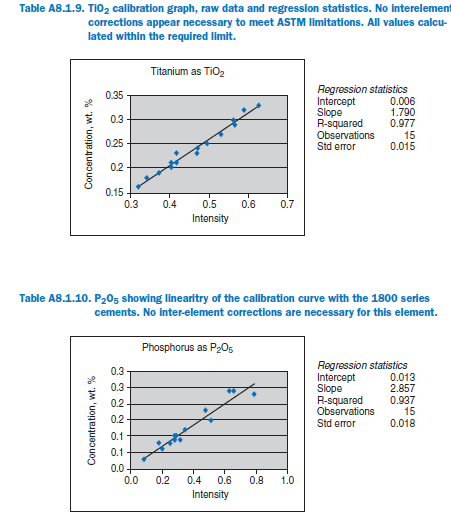
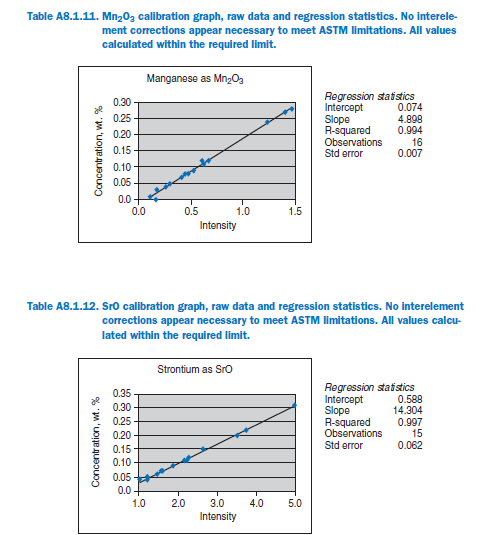
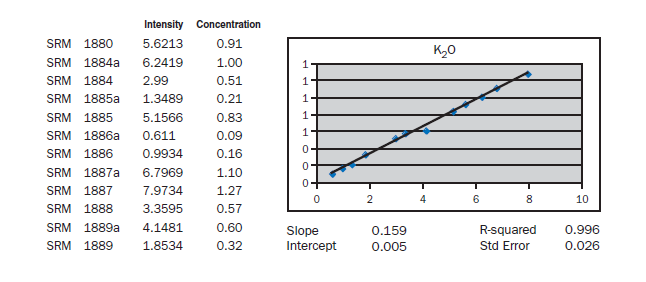
The calibration graphs shown in Appendix A use the National Institute of Standards and Technology (NIST) 600, 1800, and 1800a series portland cement certificate data. The specimens were prepared by fusing with two parts lithium tetraborate to one part sample and 25 µL of lithium bromide (prepared as above) as a nonwetting agent. A Claisse Fluxy® three position flame unit was used for fusions that were completed in three minutes, below 1000°C. Because the 600 series cements are no longer available (nor are some of the 1800 series), these graphs are shown in Appendix A for illustrative purposes only.
For elements Al, Fe, Mg, S, Na, K, Ti, P, Mn, and Sr, no interelement corrections appear necessary for meeting the qualification requirements of ASTM C 114. For elements Ca and Si minor interele-ment corrections are applied, and equations shown in each graph in Appendix A.
CLASSICAL CHEMICAL ANALYSIS OF CEMENTS
An Overview
American Society for Testing of Materials (ASTM) reference test methods are accepted by the cement industry and provide a well-integrated scheme of analysis of hydraulic cements. The test methods are described in detail and provide an analyst with an outline of analysis complete with preparation of reagents, calculations, and potential sources of errors encountered in performing the analyses (Figure 8.1.12). Careful attention to details of test methods, reagent preparation, materials handling, and repetition are key components to traditional bench chemistry. Blanks, dupli-cates, matrix spikes, and statistical analysis of data are essential for reporting values. Each of the operations from the procedures of weighing, igniting, desiccation, etc., has potential for sources of errors in cement analysis and the causes of these variations should be minimized.
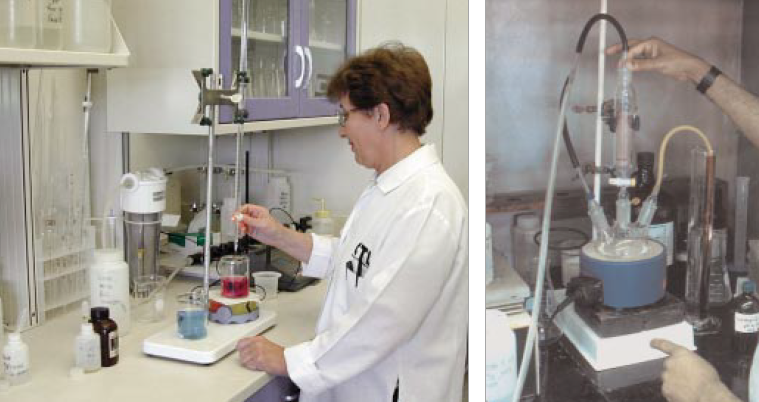
Figure 8.1.12. Typical set up for classical cement analysis procedures.
Each of the methods is a traditional “wet” gravimetric, colorimetric, or titrimetric procedure. These methods still require an analyst to use both scientific knowledge and manipulation skills to yield acceptable results. Balances should conform to Class S requirement and standard weights should routinely be used for checking the accuracy. A hot crucible coming directly from a muffle furnace should never be placed on a balance; therefore, a dessicator is used for cooling and storage. The size, number, and weight of samples and characteristics of the contents should be considered when selecting the dessicator and desiccant. Room temperature and humidity should also be considered. Usually magnesium perchlorate is the desiccant of choice in cement analysis. Mixing a few pieces of indicating Drierite® helps in the identification of spent desiccant. The container should be labeled with the type of desiccant and the date replaced. The lid and base should be clean and stopcock grease placed in a thin layer at the contact spots. The vacuum release area should also be cleaned and greased. An audible rush of air should be heard when the lid is removed or when the opening valve is rotated. In the case of calcium analysis it is most important to have a good seal as calcium oxide hydrates and carbonates very rapidly, thus biasing the results high. The cooling period is usually 30-60 minutes, depending on the crucible type, contents, and size of dessicator. Final weights should never be delayed until the next morning.
ASTM C 114 Standard Test Methods for Chemical Analysis of Hydraulic Cement
Insoluble residue. Insoluble residue is determined on portland cement and is specified by ASTM C 150 (Standard Specification for Portland Cement) to be less than 0.75% by mass. Portland cement clinker is nearly completely soluble under the conditions of the test. The sample is digested with hot dilute HCl followed by a hot NaOH digestion and finally washing with NH4NO3.Usually the source of the insoluble residue in portland cement is primarily from the impurities found in the inter-ground gypsum. Quartz and feldspars are the primary source and can be easily analyzed by collect-ing multiple insoluble residues and analyzing by either x-ray fluorescence or x-ray diffraction. High insoluble values can also be obtained by not following the processing instructions prior to chemical analysis. For chemical analysis, the cement must first pass through a Number 100 US Standard sieve. In addition, the use of a flattened end of a glass-stirring rod is recommended. By swirling the cement in acid quickly (creating a whirlpool effect), all of the undissolved cement is left in the center of the bottom of the beaker which then is further crushed by the flattened end of the stir rod and easily goes into solution. If the cement is blended with a “Class F” fly ash, the insoluble residue may compare favorably with the percentage of fly ash in the blend.
In any case of high insoluble residue, a microscopic examination of the residue and original cement is highly recommended. It is much easier and highly advantageous to identify a contamina-tion problem before the cement is used in mortar or concrete. In all cases, time and temperature must be consistent and thorough washing with ammonium nitrate should be performed to prevent finely ground insoluble material from passing through the filter.
Silicon dioxide. The determination of silica is made gravimetrically with the addition of ammo-nium chloride. A 0.5 gram cement sample is mixed thoroughly with 0.5 grams of ammonium chlo-ride in a 50 ml beaker. Addition of 5 ml of HCl is made slowly, allowing the acid to run down the lip of the covered beaker. One or two drops of nitric acid are added and the mixture is set on a steam bath for 30 minutes. The jelly-like mass of silicic acid is then transferred to a funnel fitted with a filter paper and washed thoroughly with hot dilute HCl, then with hot water. The filter paper and residue is then transferred to a platinum crucible, dried, and ignited slowly until the carbon from the filter paper is completely consumed without inflaming, then ignited at 1100-1200°C. The platinum and residue is cooled and weighed, then water, sulfuric acid, and hydro-fluoric acid are added and cautiously evaporated to dryness. The difference between the first and second weight is the weight of SiO2.
Ammonium hydroxide group. Once the silica has been removed, the filtrate should have a total volume of about 200 ml. The residue in the crucible from the silica determination is fused with potassium pyrosulfate. The crucible is then washed out with dilute HCl into the beaker with the filtrate. A few drops of methyl red are added and the solution is heated to boiling. The solution is then treated with NH4OH dropwise until the solution is distinctly yellow and then one drop in excess is added. Going past the color change by more than one drop may cause alumina to redissolve and cause low results. The solution containing the precipitate is heated to boiling. The precipitate is allowed to settle, then filtered with a medium textured filter paper and washed with hot NH4NO3. The filter paper and precipitate should not be allowed to stand overnight. In an acidic environment, the filter paper tends to complex some of the aluminum and prevents completeness of precipitation on subsequent treatment with NH4OH. The filtrate is set aside and the precipitate transferred into the original beaker and dissolved with hot HCl. The solution is then filtered and washed with hot NH4NO3. The filtrates are combined and reserved for CaO analysis. The precipitate is then transferred to a platinum crucible, charred slowly, and then ignited at 1100°C.
Alumina is not actually measured but calculated by difference. The ammonium hydroxide precipi-tate contains the Al2O3,Fe2O3,TiO2, and P2O5.In previous versions of ASTM C 150, the TiO2 and P2O5 were added to the Al2O3 when the Bogue calculation for cement compounds was performed. Currently the compounds use only the Al2O3,and thus TiO2 and P2O5 must be analyzed individu-ally and the values subtracted from the ammonium hydroxide group. Zr, Cr, and V all may precipi-tate in the ammonium hydroxide group, thus, if these compounds are not determined, the C3A value might be reported inaccurately high.
Total iron as ferric oxide. A separate 0.5 g subsample of the cement is digested in HCl. The solution is heated to boiling and treated with stannous chloride added dropwise until the solution is decolorized. The reduced solution should not be allowed to stand overnight as air oxidation can occur and cause low results. The sample is then cooled and immediately 10 ml. of mercuric chlo-ride are added and stirred vigorously. Then 10 ml. of H3PO4 is added and 2 drops of barium diphenylamine sulfonate indicator. The solution is then titrated with K2Cr2O7 solution. The end point is the intense color of purple that remains unchanged after further addition of dichromate.
Calcium oxide. Once the silica has been removed and the ammonium hydroxide group precipi-tated and removed, the calcium is precipitated as the oxalate and ignited to the oxide. It is difficult to ignite CaO to constant weight as it is hygroscopic and can pick up moisture as it is cooled and is weighed. Dead burning the lime at 1200°C for at least one hour is recommended. Magnesium perchlorate is used as a desiccant and the dessicator should be as small as possible to limit the amount of humidified air.
Calcium reference method is determined by permanganate titration after manganese is removed from the filtrate after determination of SiO2 and the ammonium hydroxide group. Strontium usually present in less than 0.60% by mass is precipitated with Ca, titrated, and calculated as CaO. In determining conformance, the correction for SrO should not be made in accordance with ASTM.
Free lime. The determination of free lime (free CaO) in clinker, cement, or concrete is commonly performed by use of extraction in an organic solvent followed by titration with acid. Pressler and others showed comparisons between techniques proposed by Bogue, Lerch, and Franke. By completely hydrating cement forming Ca (OH)2, then heating to decompose to free CaO, both compounds were determined by these methods. It is understood that free lime extraction tech-niques determine the combination of CaO and Ca(OH)2 and do not differentiate between them. Therefore, cement, which has been prehydrated, shows a high free lime value whether or not free lime existed in the original clinker.
When the value determined is high, it becomes necessary to differentiate between CaO andCa(OH)2 using either differential scanning calorimetry (DSC) or x-ray diffraction (XRD) tech-niques. Remember also that intergrinding clinker and gypsum at sufficient temperature will dehy-drate the gypsum to plaster and/or anhydrite. The water lost in the decomposition can prehydrate the cement causing erroneously high free lime values (as Ca[OH]2). Generally, when a true free lime value is required, it is best determined on freshly made clinker which is ground immediately prior to analysis.
Sulfate. Sulfate, or gravimetric SO3 analysis, is performed on a separate subsample, digested in HCl and filtered. Barium chloride is added to precipitate barium sulfate. The precipitate is filtered, charred, and ignited at 850°C, cooled and weighed. Careful charring of the paper in an oxidizing environment is necessary to minimize reduction of sulfur. This method is time consuming as the precipitation (for referee analyses) is done overnight. During the ASTM subcommittee meeting on cement analysis in June of 2001, a proposed method using ultrasonic facilitation of Oswald ripen-ing to accomplish the same 24-hour digestion in about 15 minutes was discussed. Still, the diges-tion, filtration, and ignition consume analyst time. ASTM D 516 Turbidimetric Method analysis speeds the analytical time to about one hour, as neither quantitative transfer of precipitate nor ignition of sample is needed. Accuracies can meet the performance requirements of ASTM C 114.
ALTERNATE ANALYTICAL METHODS
The Rationale
Due to their speed and accuracy, x-ray spectrometers are more common today in cement manufac-turing than other methods of chemical analysis. Instrumental methods such as atomic absorption as outlined by Crow and Connelly (1973) or classical “wet” techniques such as those outlined in ASTM C 114 are most useful alternatives. If XRF analysis yields results with precision and accuracy meeting ASTM 114, why would one need another technique? Simply, spectrometers do fail due to a number of reasons. X-ray tubes and power supplies fail and require replacing, flow proportional polypropylene windows may wear thin and break, or pressed powders may fall apart during analy-sis and deposit on the tube causing erroneous results.
If for any reason the XRF fails, an analyst needs to have backup methods readily available and qualified for use. Fortunately, bench-top energy-dispersive XRF units are available and can provide acceptable results, and their use is gaining acceptance in the cement industry. Cement chemists can utilize and check both XRF units against each other and qualify results routinely. If either primary or secondary unit fails, a backup XRF instrument is readily available. If these units are not avail-able to an analyst, other “wet” methods must be employed. Unfortunately, any other technique, if not practiced, becomes a challenge to the cement chemist. Traditional “wet” methods of chemical analysis are really an art, easily lost without practice.
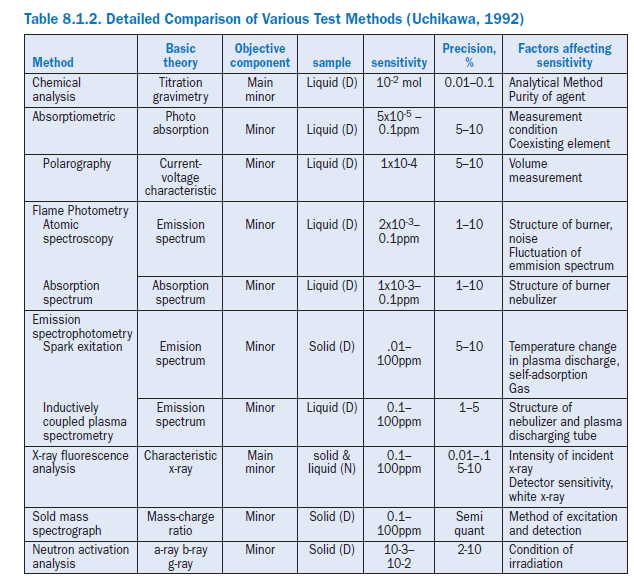
Most other wet methods, either traditional gravimetric or instrumental, take much longer time. For instance, obtaining the calcium carbonate equivalency by titration with hydrochloric acid may be one alternative method for lime saturation factor but yields only one result. Free lime analysis on the clinker may also be helpful but gives results on the material that has already been pyroprocessed. Table 8.1.2 shows alternate techniques and the accuracy obtained by their use. It is clear, however, that x-ray analysis delivers accurate chemical analyses, reliably and cost-efficiently. Few analytical techniques can be calibrated over such a wide range without further dilution of the sample.
Atomic Absorption Spectrometry
Use of atomic absorption (AA) spectrometry as method for determining elemental composition of cement has also been in use for some time. This technique, though slower than the XRF method, is a cost effective alternative back up method. Samples are dissolved in an acid solution and analyzed by AA against standard solutions of known concentrations.
The essential components of an atomic absorption spectrometer are the hollow cathode lamp, flame or electrothermal device, grating monochromator, and a photomultiplier tube. The principle operation of the instrument is as follows: The hollow cathode lamp emits radiation characteristic of the cathode material, usually a single element (analyte). The beam consisting of resonance radi-ation is electronically pulsed. Analyte atoms are produced thermally in the atom reservoir. Ground state atoms, which predominate in experimental condition, absorb resonance radiation from the lamp, reducing the intensity of the incident beam. The monochromater isolates the desired reso-nance and allows this radiation to fall on the photomultiplier. An electronic signal is generated. Signal processing occurs which results in electronic output proportional to the absorption by the analyte atoms (Van Loon).
The atomic absorption techniques described by Crow and Connolly (1973), analyze the cements by a bracketing technique. High and low concentrations of each element in the reference material are analyzed as well as the unknown cement. Three techniques – flame, furnace, or cold vapor are most common in AA analysis (Figures 8.1.13). Fortunately with today’s instruments, computer control of automated samplers can speed the analyses dramatically. All the standards as well as unknown samples can be placed in the sample changer and analyzed in any sequence.This way a calibration graph can be generated much like analysis by XRF. If the SRMs are needed for qualifi-cation and analyzed as unknowns, then synthetic calibration standards can be formulated with high-purity reagents, such as CaCO3,SiO2,Al2O3, and Fe2O3, then fused with lithium metaborate and dissolved in HNO3.Instruments usually require a blank, which is then used when plotting the calibration. For calcium and silicon, this must be avoided as the slope and intercept may not pass through zero.
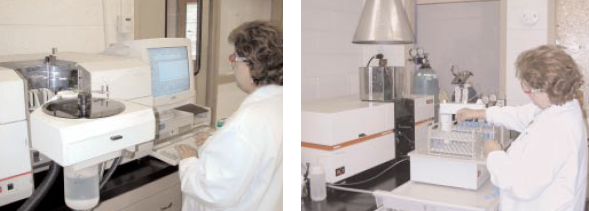
Figure 8.1.13. Atomic absorption analysis using flame, furnace, or cold vapor techniques, are useful for determining major, minor, and trace elements in cement. Automated sample handling streamlines analyses as multiple samples and standards can be run unattended.
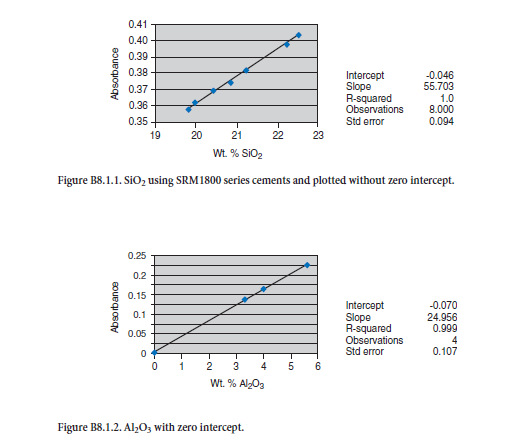
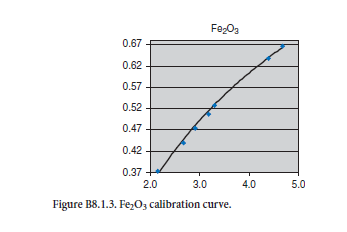
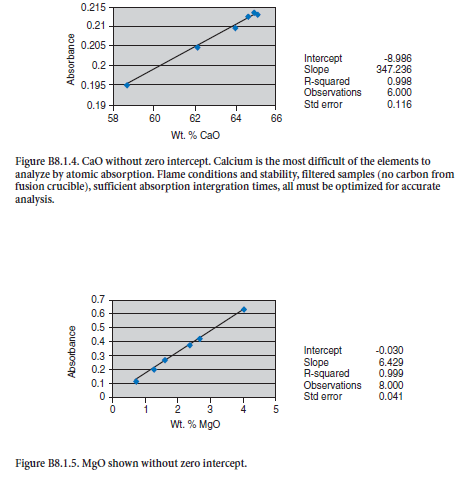
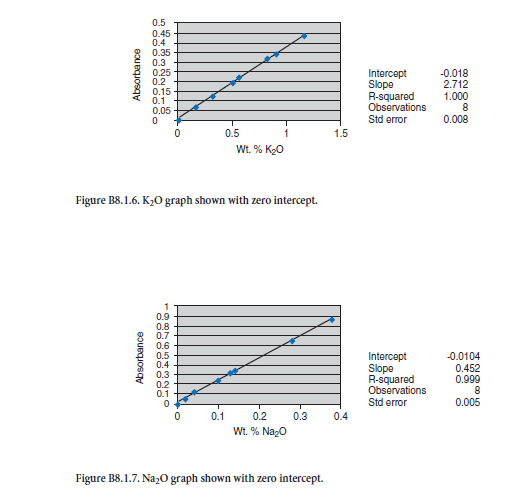
The calibration curves shown in Appendix B originate from the 1800 series of NIST SRMs mixed with LiBO2 and fused at 950°C for 10 minutes in a muffle furnace and dissolved in dilute nitric (1:24) acid. The calibrations plotted graphically are virtually straight lines with standard errors of estimate within those required by qualification by ASTM C 114. Calibration standards can be created effectively by use of high-purity reagents much as Nettles (1998), Staats (1989), and Sieber (2002) have outlined to bracket the ranges normally encountered in analysis of materials in the cement industry. The materials routinely analyzed at the cement plant include cement raw ingredi-ents such as limestone and clay, clinker, cement, kiln feed, and kiln dust. Multielement standards, which bracket concentration of unknowns, effectively compensate for matrix effects.
TRACE ELEMENTS IN CEMENT – A CASE STUDY
Application of XRF and AA Methods
Portland cement is manufactured with natural geological materials and can be supplemented with continuously generated industrial byproducts. Bhatty (1995) reviewed the role of the stable minor and trace elements in cement manufacturing. The concerns are the incorporation of trace elements into clinker and the effects on performance. The effects are largely dependent on the type, concen-tration levels, and burning parameters of the kiln. Wastes have found application as fuels and par-tial substitutions as raw feed. Spent clays from lubricating oil refining, sewage sludge, fly ash, auto-motive tires, municipal solid waste, and others all have found application in cement manufacture.
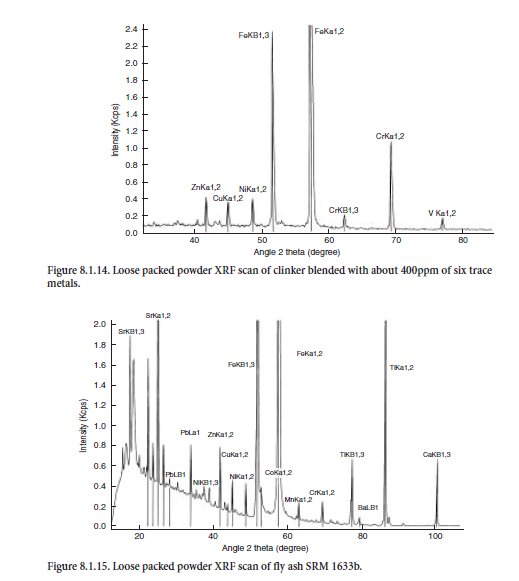
XRF method used. XRF is capable of detecting elements in the ppm range. For determining if the element is present, a simple loose packed powder can be used. This method of introducing the specimen for analysis eliminates the intense grinding of the specimen and thus the potential contamination from the processing/preparation equipment. For example, the tungsten-carbide mill used for fine grinding will contribute tungsten and cobalt. For the most part, using this method can indicate that the levels of trace elements are low enough not to interfere with cement performance characteristics. An example of the loose packed powder scan of clinkers made with six trace elements Zn, Cu, Ni, Fe, Cr, and V (concentration levels about 400 ppm) is shown in Figure 8.1.14, whereas Figure 8.1.15 shows SRM 1633b fly ash with some of the trace elements identified for comparison.
AA method used. A definitive study of the trace elements in cement and kiln dust was under-taken in 1992 by the Portland Cement Association (Delles and others, 1992). The methods used were primarily flame, furnace, and cold vapor atomic absorption spectrometry following digestions based on EPA SW 846. Details of the AA methods employed to determine trace metal concentration are described in the following text.
Antimony. Antimony was determined on samples digested according to EPA Method 3051 to minimize volatilization losses. Analysis was performed according to EPA method 7041 graphite furnace atomic absorption spectrometry (GFAA). Ammonium phosphate was used as a modifier and background correction was made at 217.6 nm. Samples were injected onto a hot platform in the furnace. Atomic absorption flame analysis showed spectral line interference, which biased the flame values high.
Arsenic. Arsenic was determined by GFAA according to EPA Method 7060 on samples digested according to EPA Method 3050B. Samples were injected onto a platform tube and measurements made at 1933.7 nm using nickel nitrate as a modifier and deuterium background correction. EPA Method 7061 using hydride generation yielded acceptable results; however, digestion took approxi-mately 12 hours to complete.
Barium. Barium was determined by flame AAS according to EPA Method 7060 after digestion procedure 3050A. A fuel-rich nitrous oxide/acetylene flame was used and measurement was made at 553.6 nm. Potassium chloride was added to the solution before analysis to suppress ionization of barium in the flame.
Beryllium. Beryllium was determined by GFAA according to EPA Method 7091 after digestion according to EPA Method 3051. Samples were injected onto a hot platform tube in the furnace and measurement made at 234.9 nm with deuterium background correction. The EPA method 7091 warns of severe interference and possible erroneous high results due to high temperature needed for ashing and atomizing.
Cadmium. Cadmium was determined by GFAA according to EPA Method 7131 after digestion 3051. Samples were injected onto a hot platform tube in the furnace. Ammonium phosphate was used as a modifier and measurement made at 357.9 nm with deuterium used for background correction.
Chromium. Chromium was determined by flame AAS according to EPA Method 7190 after diges-tion procedure 3050A. A reducing nitrous oxide/acetylene flame was used and measurement made at 357.9 nm. Background correction at this wavelength is not appropriate due to the very low output of the deuterium lamp.
Lead. Lead was determined by GFAA according to EPA Method 3051 after digestion according to Method 3050A. A 1% solution of phosphoric acid was used as a matrix modifier and samples were injected onto a hot platform tube in the furnace. Measurement was made at 283.3 nm with back-ground correction.
Mercury. Mercury was determined by continuous flow flameless cold vapor AAS according to EPA Method 7471, after digestion according to 7471 (permanganate/sulfuric acid/nitric acid). The cold vapor method removes interferences and only mercury is determined in the vapor phase. Measurement was made at 253.7 nm.
Nickel. Nickel was determined by flame AAS according to EPA Method 7520 after digestion according to Method 3051. Measurement was made at the alternate wavelength of 352.4 nm using deuterium background correction and an oxidizing air-acetylene flame.
Selenium. Selenium was determined by GFAA according to EPA Method 7740 after digestion according to EPA Method 3051. A nickel nitrate modifier was used and measurement made at 196.0 nm with deuterium background correction. Sample size was limited by the presence of volatile constituents that carried selenium out of the graphite tube during the ashing step. The detection limits were not as low as might be achieved in a different matrix.
Silver. Silver was determined by flame AAS according to EPA Method 7760 after digestion with Method 3050B. An oxidizing air/acetylene flame was used and measurement made at 328.1 nm. In few cases spike recoveries were low, indicating the possibility of chloride reacting with the solver forming insoluble silver chloride. A vigorous nitric acid digestion for analysis of silver is critical for accurate results.
Thallium. Thallium was determined by GFAA according to Method 7841 following digestion according to Method 3051. A modifier of palladium with citric acid was used and measurements made at 276.8 nm using a hot platform tube. Deuterium background corrections were used in the analysis.
Method detection limits and method quantification limits were calculated on all samples. Factors that affect the detection limit are instrument stability, hollow cathode lamp intensity, sample matrix, and analyte sensitivity. The detection limits were calculated according to EPA’s formula:
MDL=
3µ/m where,
MDL = method detection limit
µ= standard deviation of the absorbance, and
m = slope of the calibration curve.
EPA defines the minimum quantification limit (MQL) as the minimum number that can be reported with a known confidence and is five times the standard deviation of the analyte concen-tration. These numbers were calculated for each sample in a similar way to the minimum detection limit and equal to 1.6667 times the MDL.
STATISTICAL ANALYSIS OF DATA
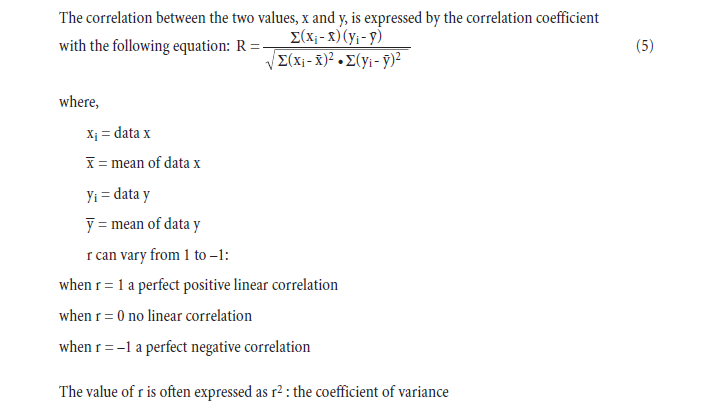
The methods described above show only the techniques involved, use of chemical reagents, and data obtained. This is clearly never the end of chemical analysis as it is necessary to control and verify the procedures used through statistical analysis. Simple reporting of data may be useless without some estimate showing that the analysis is under control and accurate. ASTM C 114 qualification aims at verifying that the cement elemental analysis data is within an acceptable range of accuracy and preci-sion. Each analysis is completed in duplicate on different days and the difference between duplicates is some measure of precision. For accuracy consideration, the averages of those duplicates are compared against certificate values. Accuracy is a measure of the trueness to a “certified value” and precision a measure of scattering around a mean value. This can be expressed as a standard deviation or standard error. Bias is a consistent deviation from the true value caused by systematic errors in a procedure. Bias can originate from the method, laboratory, or the sample itself.
Sampling and specimen preparation influence the result and a description of each step should be included in a final report of analysis. In some cases, the laboratory has no control of field sampling as samples are delivered by outside personnel. In this case, a final report should indicate the origin of the sample.
The primary parameters of statistical treatment are the mean and standard deviation and the main tools regression and correlation analysis.
The mean of a set of n data, is expressed by:
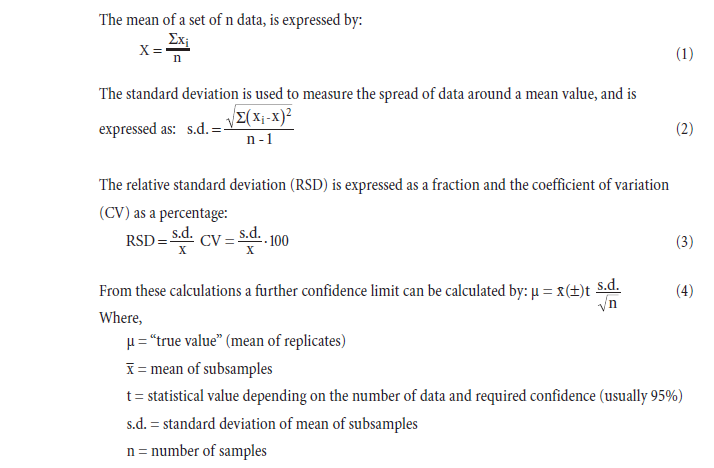
Linear correlation and regression are used most extensively in instrumental analysis as calibration graphs are constructed and a measure of the performance of the method calculated. In regression analysis a response is assumed; changes in x result in changes of y. The resulting line takes the form of:
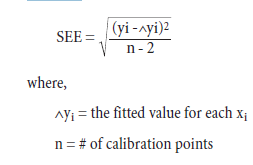
The fitting of the calibration graph is necessary because the response points do not fall exactly on the line; therefore random errors are implied. A practical and often used quantification of this uncertainty is the standard error of estimate, SEE, (reported on calibration graphs shown in this chapter).
Validation of any procedure is a necessary parameter in any analytical work. Method performance characteristics for validation include such parameters as accuracy, precision, recovery, sensitivity (detection limits), working ranges, and interferences. The ability to retain the above performance characteristics with minor changes in experimental condition, i.e., fusion time and temperature, is the ruggedness of the method.
All of the above formulas are easily input in today’s modern spreadsheets such as EXCEL®.The use of these spreadsheets is an integral part of chemical analysis, as data can be interpreted for many analytical runs, various operators, and many days or months of analyses. This practically ensures that unacceptable data is not released or processes changed without significant validation.
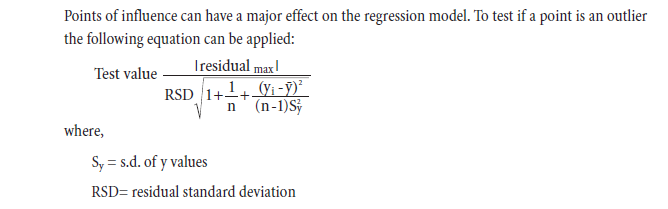
The following guidelines should be used to examine data sets:
• graphically plot the data
• review the residuals (differences between calculated and real values)
• ifa valid reason is available, remove points of influence
RESOURCES
Each year new analytical techniques and new approaches to problem solving are presented at conferences. Three main conferences of interest to the cement chemistry field and industry include The Annual Denver X-ray Conference (DXC), International Conference on Cement Microscopy (ICMA) and the Cement Chemist Society (CCS). The DXC specifically targets the use of x-ray analysis; both x-ray fluorescence and x-ray diffraction and many papers on cement and related minerals analysis are included in topics each year. Several special sessions have been organized specifically targeted to the cement industry. ICMA has traditionally targeted the use of cement microscopy but in recent years has included sessions on cement chemistry as well, which has been a welcomed addition to the conference. The CCS is now in its 7th year, encompasses wide range of topics from quarry management to process control. For additional information see the following:
Denver X-ray Conference
Sponsored by:
International Center for Diffraction Data
12 Campus Blvd.
Newtown Square, PA 190731-3273
Phone: (610) 325-9814
www.icdd.com
International Cement Microscopy Association
2809 Juniper Dr.
Metropolis IL 62960
Fax: (618) 524-5841
www.cemmicro.org
Cement Chemist Society
P.O. Box 702791
Dallas, TX 75370
Phone: (214) 731-1288
www.ccsociety.org
SUMMARY
Portland cement elemental composition is determined rapidly and accurately using XRF analysis. The equipment has improved markedly over the last 40 years and has gained wide acceptance in the cement laboratory. Easily qualified under the performance requirements of ASTM C 114, this technique reliably keeps the cement plant producing quality product day after day. Some manufac-turers have included x-ray diffraction channels in their spectrometers for analysis of free lime in clinker as well. It is likely that cement plants will move toward cement and clinker phase analysis as well by using quantitative diffraction techniques. Other analytical techniques should be used routinely to keep mastery of the method if instruments fail. Statistical evaluation of results is necessary to validate methods, equipment, and personnel.
APPENDIX A
Calibration data obtained using NIST SRMs, fused two parts flux one part sample for 3 minutes using Claisse Fluxy 3 place flame unit. Analyzed on wavelength dispersive spectrometer at 30kW, 80mA.
APPENDIX B
Lithium metaborate fused cement reference material dissolved in dilute nitric acid.
APPENDIX C
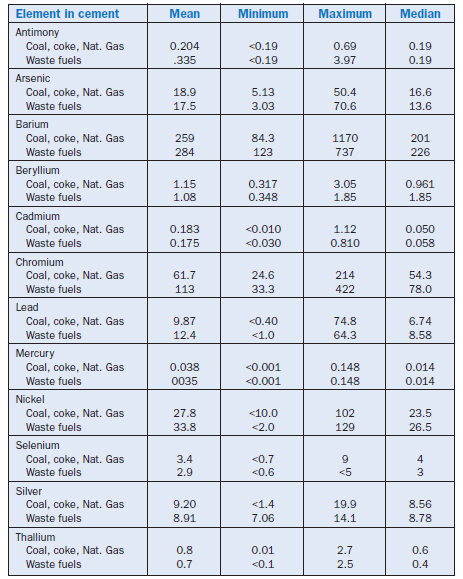
The following table shows the mean, minimum, maximum, and median values for cements from 97 North American cement plants using coal, coke, or natural gas versus waste fuels. Summary Data Table extracted from “An Analysis of Selected Trace Metals in Cement and Kiln Dust” Portland Cement Association SP 109T. All values listed in mg/kg.
APPENDIX D
Loose-packed powder calibration data using selected NIST Standard Reference Material.
APPENDIX E – SOURCES REFERENCE MATERIALS
Alpha Resources, Inc.
Box 199
Stevensville, Michigan 49127
(219) 465-5559 (1-800-833-3083) www.alpharesources.com
Analytical Reference Materials Inter. Inc.
700 Corporate Circle
Golden, Colorado 80401
(303) 216-2621 www.armi.com
A.S.O. Design
83 Beacon Rd. Kirkland
Quebec Canada H9J 2E9 sales@asocananda.com
Ph (514) 697-8362 fx (514) 697-2587
Brammer Standard Company, Inc.
14603 Benfer Road
Houston, Texas 77069-2895
(713) 440-9396 www.brammerstandard.com
Breitlander Eichproben+Labormaterial
GmbH, Hans-Sachs Str. 12 D-59077
Hamm Germany. Tel (0)2381/404000 Fax /403189 mail@breitlander.com
Geochemical Reference Materials
CRC Press
2000 Corporate Blvd
NW Boca Raton, Florida 33431
G. Frederick Smith Company
PO Box 245
Powell, Ohio 43065
(800) 881-5501
National Institute of Standards and Technology Standard
Reference Materials Program
Bldg 202 Rm 204
Gaithersburg, Maryland 20899-0001
(301) 975-6776 www.nist.gov
REFERENCES
Anzelmo; Seyfarth; and Arias, Approaching a Universal Sample Preparation Method for XRF Analysis of Powder Materials, Advances in X-ray Analysis, Vol. 44, 2001.
American Society for Testing and Materials, Annual Book of ASTM Standards, 2002.
Bean, Leanard B., and Dise, John R., Causes of Variation in Chemical Analyses and Physical Tests of Portland Cement,National Bureau of Standards, Monograph 28, April 27, 1961.
Bennett H., and Oliver G., XRF Analysis of Ceramics, Minerals, and Allied Minerals, John Wiley & Son, Ltd.
Bertin, E. P., Principles and Practice of X-ray Spectrometric Analysis, Plenum Press, 1984.
Bertin, Eugene P., Introduction to X-ray Spectrometric Analysis, Plenum Press 1985.
Blizard, R. G., Reflections on the History of the Chemistry of Cement, 1998.
Broton, D., Lithium Based Borate Fusion of Gypsum/High Sulfate Samples, A New Approach, Advances in X-ray Analysis Vol. 41 pages 868-872, 1999.
Buhrke, V. B.; Jenkins, R.; and Smith D. K., A Practical Guide for the Preparations of Specimens for X-ray Fluorescence and X-Ray Diffraction Analysis, Wiley, 1998.
Crow, R.F.,and Connolly, J. D., Atomic Absorption Analysis of Portland Cement and Raw Mix Using Lithium Metaborate Fusion, ASTM Journal of Testing and Evaluation, September 1973.
Delles, et al., An Analysis of Selected Trace Metals in Cement and Kiln Dust, Portland Cement Association Serial SP110, 1992.
Deming, William Edwards, Some Theory of Sampling, Wiley, 1950.
Gebhardt, Ronald F., Rapid Methods for Chemical Analysis of Hydraulic Cement, ASTM STP.
International Organization for Standardization’s ISO Guide 30:1992, Terms and definitions used in connection with reference materials.
Jenkins, R., and De Vries, J. L., Practical X-ray Spectrometry, Springer Verlag, 1969.
Jenkins, R., Worked Examples in X-ray Spectrometry, Heydon & Son Ltd., 1974.
Kocman, V., Rapid Multi Element Analysis of Gypsum and Gypsum Products by XRF.
Lajunen, L. J., Spectrochemical Analysis by Atomic Absorption and Emmision, Royal Society of Chemistry, 1992.
Leslie, Robert W., History of the Portland Cement Industry, 1924.
Marjanovic, L., et al., Analysis of cement by inductively coupled plasma optical emmision using slurry nebulization, The Royal Society of Chemistry, 2000.
Nettles, Scott, Preparation of Cement Standards using Pure Compounds, Proceedings of the 48 Annual Denver X-ray Conference, 1998.
Pressler, et al., Investigation of the Franke Method of Determining Free Calcium Hydroxide and Free Calcium Oxide, Research Department Bulletin 62, Research and Development Laboratories of the Portland Cement Association, Skokie, Illinois.
Rosauer, Elmer A., Instruments for Materials Analysis, Iowa State University Press, 1981.
Sieber; Broton; and et al., Standard Reference Materials for Cements, Cement and Concrete Research, December 2002.
Sieber J. R., Matrix independent XRF Methods for Certification of Standard Reference Materials, Adv X-Ray, 2002.
Staats, Gotthard, On the role of pure oxide materials for primary calibration and validation in inor-ganic bulk analysis, Fresenius Z Anal Chem, 1990.
Staats, Gotthard, Synthetic macro-reference samples for calibration of instruments in inorganic bulk analysis, Fresenius Z Anal Chem, 1989.
Van Loon, and Jon C., Analytical Atomic Absorption Spectroscopy, Selected Methods. Academic Press, 1980.
Weston K., The Sampling and testing of cements, World Cement, April 1986.
Uchikawa, Hiroshi, Advances in Physico-Chemical Characterization and Quality Control Techniques for Cement and Concrete, Invited General report of the 9th International Congress on the Chemistry of Cement, 1992, New Delhi, India.