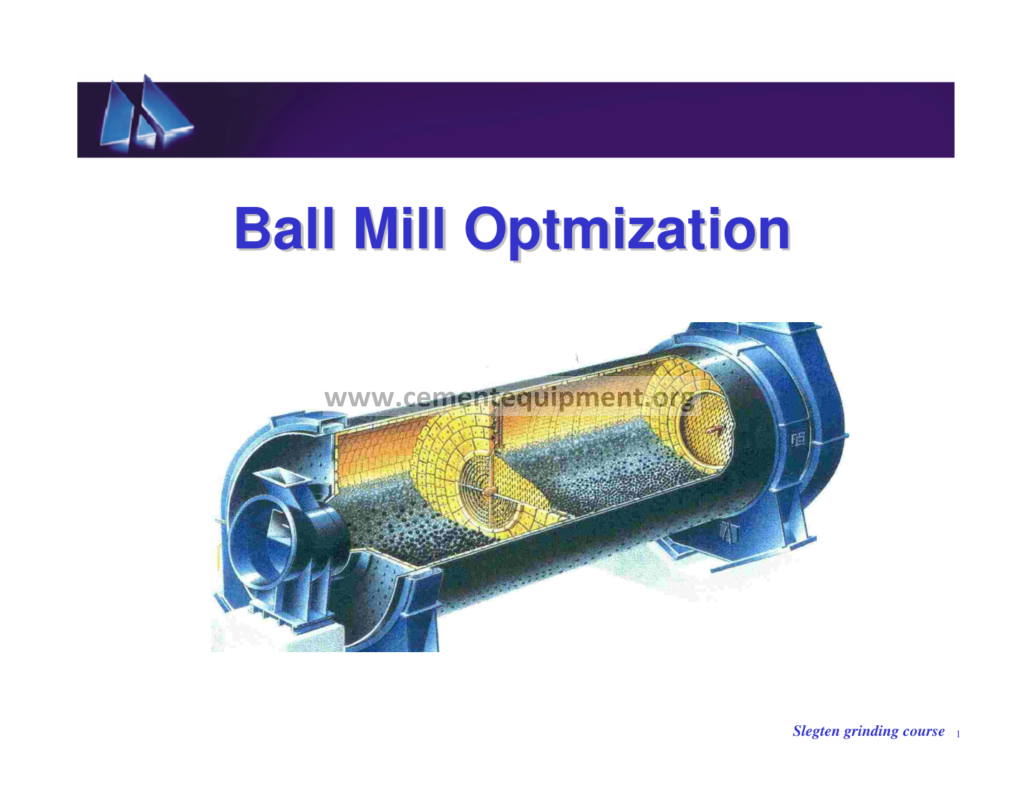
Ball Mill Optimization: Full Plant Study & Methods
Ball mill optimization is the process of getting the maximum output, minimum specific power and most stable quality out of an existing grinding circuit without replacing the machine. Most cement plants operate their finish mills well below the achievable optimum: the ball charge has degraded, the separator has drifted, the feed size has changed, and the control loops are tuned for conditions that no longer exist. The result is 5 to 20 percent lost capacity and 3 to 8 kWh per tonne of avoidable energy consumption, repeated every year because nobody owns the optimization as a systematic process. This article is a complete, practical guide to ball mill optimization for the cement industry. It explains the performance baseline, the audit, the optimization of speed, charge, liners, diaphragm and separator, the role of grinding aids and process control, the use of simulation, and the management process that turns one-off improvements into sustained performance. It is written for process engineers, production managers and plant consultants who need both the theory and the checklist.
1. What Optimization Really Means
Optimization is not a single adjustment; it is a continuous engineering process with a defined objective. For a finish mill, the objective is normally expressed as minimum specific power at target fineness and strength, subject to constraints on temperature, separator load, mill availability and product quality. The three measurable variables are the production rate in tonnes per hour, the specific electrical energy in kWh per tonne, and the product quality expressed as Blaine fineness, residue on 45 micrometers and the Rosin-Rammler distribution. Optimization finds the operating point that maximizes the first, minimizes the second and holds the third within specification, and it does this within the physical limits of the machine.
The first principle of optimization is that every effect must be measured. A mill circuit has roughly twenty variables that influence performance — feed rate, feed size, clinker grindability, moisture, mill speed, charge filling and grade, liner profile, ventilation, water injection, separator speed, separator air flows, bypass, grinding aid dose, and the control loop set-points — and no optimization is credible without the data for at least the first ten. The second principle is that the variables interact: raising separator speed to sharpen classification changes the mill load, which changes the optimum charge grade. The third principle is that the equipment has a knee: the optimum point is where the marginal benefit of a further change is less than its marginal cost, and that point must be found by testing, not by guesswork.
2. Establishing the Baseline
Optimization starts with a baseline that answers three questions: where is the circuit now, what is it capable of, and where is the gap. The baseline is built over a representative period of two to four weeks of stable operation, using the plant data historian or manual logs, and includes: average feed rate and its standard deviation; specific power for mill, separator, fans and the whole circuit; product fineness, residue and distribution; reject rate and circulating load; mill inlet and outlet temperatures; mill differential pressure; separator settings; and the quality data for clinker, gypsum and finished cement. The baseline must also capture the operating mode, because a mill that runs at 90 percent of its rating for marketing reasons has a different optimum than a mill that is production-limited.
The capability assessment compares the baseline with three references: the mill design curve supplied by the manufacturer, the Bond calculation for the current feed and fineness, and the actual performance of comparable mills in the group or industry. The Bond calculation is the anchor: for the measured feed 80 percent passing, product 80 percent passing and the measured work index of the clinker, the calculation gives the theoretical energy and therefore the theoretical capacity, and the gap between theoretical and actual is the optimization potential. A plant that grinds at 32 kWh per tonne when the Bond calculation says 26 is carrying 6 kWh per tonne of avoidable loss, worth about one dollar per tonne in electrical energy alone on a typical tariff.
3. The Complete Mill Audit
The baseline is a desk exercise; the audit is a physical one. The full audit has four parts. The mechanical audit inspects the mill internals during a planned stop: charge filling and grading in both compartments, liner thickness and profile, diaphragm slot openings, grate condition, ventilation duct and filter state. The instrumentation audit verifies the sensors the operator depends on: mill power transducer, differential pressure transmitters, temperature probes, feed rate scales and the separator speed and damper feedback. The process audit runs a matrix of trials at different feed rates, separator speeds and ventilation settings, sampling the circuit at each point to build the performance curves. The quality audit correlates the fineness and residue data with the mill variables to identify which parameter the plant is actually controlling and which parameter decides the quality specification.
The audit output is a prioritized finding list, ranked by economic impact. In typical audits the top findings are the same ones recurring across plants: a degraded ball charge with an excess of undersized media, a separator running at wrong cage speed or with leaking flaps, a ventilation system throttled by a dirty filter, a water injection system not calibrated, and a feed size distribution that has coarsened because the clinker crusher or the ball mill pre-crusher is worn. Each finding carries a cost estimate, because the plant decides priorities on money, not on technical elegance.
4. Optimizing the Ball Charge
The ball charge is the largest single lever, and its optimization follows four steps. Step one is to measure the actual grade against design by screening a stopped-mill sample; the design charge is documented in the mill file and should include the size-by-size weight fractions and the expected filling degree. Step two is to correct the grade: remove the undersized fraction below about 20 percent of the maximum ball diameter, replace it with the correct sizes, and set the total weight to the design filling. Step three is to verify the charge against the current feed size, because if the clinker has coarsened or the pre-grinder has changed the feed 80 percent passing, the design charge itself is obsolete. Step four is to install a media management program: a documented addition schedule that tops up with the correct size distribution at weekly intervals and reconciles the additions against the consumption calculated from the charge weight loss.
The measurable response to a corrected charge is immediate: mill power normalizes, the first compartment retains its coarse fraction, the second compartment stops grinding oversized particles, and the separator reject and circulating load fall. Capacity gains of 5 to 12 percent on a degraded charge are the normal result, with specific power falling in proportion, and the improvement is visible in the very first week after the re-grade.
5. Optimizing Speed, Liners and Diaphragm
Mill speed is fixed by the gearbox in most plants, so its optimization is usually a verification: the actual speed measured at the shell must be within 1 percent of the design, and the design speed must be in the 70 to 75 percent of critical range appropriate for the charge and liners. When the speed is adjustable, the optimum is found by a speed sweep with charge and feed held constant, plotting specific power against speed; the classic result is a minimum at 72 to 76 percent of critical with the charge slipping below and cataracting above.
Liner optimization is a campaign-level decision. When the liners are due for replacement, the profile choice is reviewed against the compartment duty: an aggressive wave profile for the first compartment if the feed is coarse, a gentle profile for the second compartment if fine grinding is limited by cushioning, and rubber liners in the fine compartment where the temperature and impact permit. The review uses the audit data, and the decision criterion is the payback of the liner investment through capacity and wear savings.
Diaphragm optimization is the same at the component level: slot sizes reviewed against the actual ball grade, screen condition restored, and the free area of the grates brought back to design. Where the audit shows a persistent first-compartment flooding, the modern solution is a double-screen diaphragm with a central discharge that returns coarse material to the first compartment while passing fines forward, and this single component change has delivered 5 to 10 percent capacity gains on several documented installations.
6. Optimizing the Separator and the Circuit
The separator decides what the mill must produce: every tonne of oversize returned to the mill is grinding energy spent twice. The separator optimization has five dials. The cage speed sets the cut size: higher speed, finer cut, finer product, higher reject. The main airflow sets the dispersion and the product transport: too little air, poor dispersion and high bypass; too much air, coarse entrainment and reduced efficiency. The secondary and tertiary air flows adjust the classification sharpness by changing the flow distribution in the classifying zone. The bypass, the fraction of feed that passes directly to the fines without classification, must be minimized by maintaining the air seals, the feed distribution and the vane condition. And the feed dispersion must be uniform around the cage, checked by temperature or fineness sampling at the separator feed point.
The circuit-level optimization then balances mill and separator: the mill is run at its maximum stable load, the separator is set to the fineness target, and the circulating load is allowed to settle where the system wants it. The control strategy is to hold the separator reject rate constant as the primary load indicator, rather than holding feed constant, because reject rate integrates the whole circuit state. The optimum circulating load is found from the circuit characteristic curve, and the documented relationship in cement grinding is a rising capacity with rising circulating load up to the practical limit set by the elevator and the separator capacity, typically 200 to 300 percent.
7. Grinding Aids and Chemical Optimization
Grinding aids are the chemist’s contribution to mill optimization. The additives, typically alkanolamines, glycols and polymer blends dosed at 200 to 800 grams per tonne, act at the particle surface: they reduce the surface energy that makes fine particles agglomerate, disperse the charge in the mill and the separator, reduce ball coating and improve the separator efficiency. The documented effects are a 5 to 15 percent capacity increase, a similar reduction in specific power, a finer product at the same energy, and improved separator performance measured as lower bypass. The aids also influence cement quality: some formulations accelerate strength development, others modify the particle size distribution to shift the strength without changing the Blaine.
The optimization of the aid system is a dosing study: run the circuit at a matrix of dose rates, measure capacity, power, fineness and strength, and build the dose-response curve. The economic optimum is where the value of the extra capacity and energy saving exceeds the aid cost, and on most plants the optimum is not the maximum dose. The aid delivery system matters as much as the chemistry: the dose must be proportional to the feed rate, the nozzles must atomize at the mill inlet, and the storage and dosing must be winterized because many aids freeze or thicken in cold climates.
8. Process Control and the Load Optimization Loop
The control system turns the optimized settings into sustained operation. The minimum viable control scheme for a finish mill is a load control loop: the feed rate is manipulated to hold the mill differential pressure or the mill power in the band found during commissioning, with the separator speed on the fineness loop and the reject rate as the alarm and secondary input. The next level is a supervisory layer that adjusts the set-points with the feed size, clinker grindability and moisture from the quality data. The top level is model predictive control, which coordinates mill feed, separator speed, ventilation and water injection against the quality and cost objectives; reported gains over well-tuned conventional control are 3 to 6 percent capacity and a measurable reduction in fineness variability.
The optimization process itself must also be managed: the control parameters, the set-points and the quality data must be reviewed monthly, because the clinker quality, the media condition and the market fineness target drift with time. The standard practice in optimized plants is a monthly grinding performance review with a fixed agenda: production versus baseline, specific power versus Bond reference, quality trend, media consumption and additions, separator audit findings, and the plan for the next month.
9. Simulation as an Optimization Tool
Steady-state and dynamic simulation are now standard tools for ball mill optimization, because they allow the engineer to test changes without risking production. A calibrated circuit model contains the mill power equation, the charge model, the separator efficiency curve and the material transport functions, and it reproduces the measured baseline within a few percent. The model is then used to explore: the effect of a re-graded charge on the circulating load; the response to a separator vane change; the capacity effect of a pre-grinder; and the quality effect of a different clinker. The model also supports what-if studies for capital projects, so that the payback of a new separator or a high-pressure grinding roll pregrinder is computed on the plant’s own data before any money is spent.
The discipline of simulation is calibration: an uncalibrated model is a toy, and the calibration uses the audit data of feed, product, reject, power, temperature and circulating load. Once calibrated, the model is also the living documentation of the circuit, updated after every significant change, and it becomes the training ground for the operators who run the plant.
10. The Optimization Roadmap and Its Economics
The roadmap that delivers results in practice has a fixed order, because each step changes the conditions for the next. Step one, the baseline and audit, costs a week and finds the opportunities. Step two, the operational corrections — charge re-grade, media program, separator cleaning and adjustment, ventilation restoration — cost little and recover 5 to 15 percent. Step three, the control improvements, recovers another 3 to 6 percent at software cost. Step four, the grinding aid optimization, recovers 5 to 15 percent at operating cost that must be justified by the gains. Step five, the component upgrades — double-screen diaphragm, new separator internals, pregrinder — are the capital projects justified by the first four steps’ data. The cumulative effect of a full program is typically 15 to 30 percent more capacity at 10 to 20 percent lower specific power on the same mill, and the program’s cost is recovered in months, not years.
| Optimization Step | Typical Gain | Investment | Payback |
|---|---|---|---|
| Baseline and audit | Identifies 5-20% potential | Low | Immediate |
| Ball charge re-grade | 5-12% capacity | Low | Weeks |
| Separator tuning | 5-10% capacity | Low | Weeks |
| Control improvement | 3-6% capacity | Software | Months |
| Grinding aid study | 5-15% capacity | Operating | Months |
| Double-screen diaphragm | 5-10% capacity | Medium | 1-2 years |
| New separator or HPGR pregrinder | 10-30% circuit | High | 2-4 years |
11. Pitfalls and Limits of Optimization
Optimization has its own failure modes, and the most common is optimizing the wrong variable: chasing Blaine fineness when the specification is the 45-micrometer residue or the strength, and squeezing the mill until the separator or the elevator becomes the bottleneck. The second failure mode is optimizing a single day instead of the month: pushing feed rate until the differential pressure runs at the top of the band and the mill grinds out every second night, losing the week’s average to instability. The third is ignoring the constraints above the mill: a 10 percent mill gain that the kiln or the cement silos cannot absorb is a gain that is paid for but not collected. The fourth is measurement drift: optimizing on sensors that have drifted is optimizing on fiction, which is why the instrumentation audit comes before the process audit. And the fifth is the human factor: the best settings are worthless if the shift operators do not understand them or trust them, which is why training and documentation are part of every serious optimization program.
12. Sustaining the Optimized State
Sustaining is harder than achieving. The optimized state decays because media wears, filters clog, sensors drift and control loops are retuned by well-meaning shifts. The sustaining mechanisms are the KPI review, the inspection calendar and the change control. The KPI review monitors specific power, capacity and fineness against the baseline every month, with the Bond reference as the watchdog; a deviation triggers a diagnosis before it becomes the new normal. The inspection calendar fixes the stop-based measurement of charge, liners, diaphragm and separator at the intervals that catch drift early. The change control requires that every change to settings, internals or control logic is logged with its author and its measured effect, so the circuit’s knowledge is not lost with the person who made the change. With these three mechanisms, the optimized mill stays optimized, and the plant collects the gain for as long as it operates.
Frequently Asked Questions
How much can ball mill optimization really improve performance?
A full program on a typical finish mill delivers 15 to 30 percent more capacity and 10 to 20 percent lower specific power, of which the operational steps alone — charge re-grade, separator tuning and control improvement — deliver 10 to 20 percent at low investment. The remaining gains come from component upgrades justified by the audit data.
Why is the Bond calculation used as the optimization reference?
The Bond calculation converts the measured feed size, product fineness and work index into a theoretical energy demand. The gap between that theoretical energy and the measured consumption quantifies the total optimization potential, and the audit then allocates the gap to its causes.
What is the most common cause of lost mill capacity?
The most common finding in audits is a degraded ball charge with an excess of undersized media, followed by a separator operating off its design point and a ventilation system throttled by a dirty filter. All three are correctable in a planned stop at low cost.
Does a higher circulating load always improve the mill?
Up to the practical limit of the elevator and separator capacity, a higher circulating load normally increases mill capacity because the mill grinds coarser material at higher throughput. Beyond that limit the system bottlenecks, and the optimum is found from the circuit characteristic curve, not by maximizing the load.
How often should the mill be re-audited?
The internal inspection with charge and liner measurement should follow the media consumption and wear schedule, typically every 6 to 12 months. The process audit should follow every significant change — new charge, new liners, new separator settings, changed clinker — and the KPI review should run monthly.
Summary
Ball mill optimization is a systematic process with a measurable return: baseline, audit, operational corrections, control improvement, chemical optimization and justified capital upgrades, sustained by monthly KPIs and disciplined change control. The theory anchors the process — Bond work index, filling degree, critical speed and separator efficiency — and the practice delivers 15 to 30 percent capacity and 10 to 20 percent lower specific power on mills that most plants thought were running normally. The key lessons are that every effect must be measured, the variables interact, the equipment has a knee, and the results must be sustained by management, not by heroics. For the plant that implements it, the mill is not a fixed asset with a fixed output: it is a machine with a large, accessible reserve of performance, and optimization is the process of collecting that reserve.
13. The Optimization Team and the Data Collection Protocol
The ball mill optimization is a team effort of the production, the quality and the maintenance departments, and the data collection protocol is the foundation of the team’s work: the mill power and the amps from the electrical records, the feed rate and the composition from the batching system, the inlet and the outlet temperatures, the ventilation flow, the separator settings, the fresh feed and the product fineness, the Blaine and the residues from the hourly laboratory samples, and the ball charge level from the operational measurements. The protocol defines the sampling frequency and the data reconciliation so the optimization decisions rest on the comparable records: the single-day snapshots are replaced by the weekly and the monthly trends, and the process conditions are normalized for the ambient temperature, the clinker quality and the feed moisture. The plant that collects the disciplined data set is the plant that optimizes with the evidence.
14. The Stepwise Optimization Campaign
The optimization campaign proceeds in the controlled steps: the first step verifies the equipment condition (the liner profiles, the ball charge, the diaphragm integrity, the separator geometry), the second step adjusts the ventilation and the temperature windows, the third step tunes the separator speed and the damper positions, the fourth step balances the feed composition and the moisture, and the fifth step validates the results over the stable week of the operation. Each step changes one variable at a time, the response is measured within the 24-48 hours and the cumulative effect is tracked against the baseline power and the quality: the typical campaign results include the 5-15% specific energy reduction, the 1-3% capacity gain and the tighter fineness control, and the campaign documentation becomes the standard operating procedure of the mill.
15. The Optimization Case Studies of the Common Plants
The case studies of the common mill optimizations illustrate the gains: the mill that shifted its separator from the second to the third generation gained the 10-15% capacity at the same fineness; the mill that corrected its ventilation from the 0.8 to the 1.2 m/s reduced the outlet temperature by 15 degrees and the agglomeration; the mill that optimized its ball charge from the single-compartment mix to the two-compartment graded charge gained the 4-6% power reduction; the mill that installed the grinding aid dosing cut the specific energy by the 8-12% at the fixed Blaine. The common thread of the cases is the systematic method: the baseline, the single-variable changes, the measured responses and the documented results.
16. The Mill Sound and the Power as the Control Instruments
The mill sound and the mill power are the real-time control instruments of the ball mill operation: the sound level of the first compartment indicates the ball charge and the feed conditions (the loud metallic sound signals the underfed mill with the balls striking the liners, the dull sound signals the overfed mill with the charge cushioning), the mill power draw indicates the charge weight and the grinding activity (the power increases with the charge level and the feed, the power drops signal the charge losses or the liner wear), and the modern plants use the electronic ear systems and the vibration sensors that convert the mill acoustics into the control signals for the automatic feed regulation. The power and the sound data are correlated with the product fineness and the mill throughput: the experienced operators read the mill state from the instruments, and the control systems use the sound and the power feedback to hold the mill at its optimum operating point: the acoustics of the mill are the continuous voice of the grinding process.
17. The Quality-Linked Optimization and the Energy Accounting
The optimization of the ball mill is ultimately measured in the product quality and the energy: the energy accounting of the mill (the kWh per tonne at the reference Blaine, the specific energy of the grinding, the energy share of the total plant consumption) provides the economic scoreboard of the operation, and the quality-linked optimization ties the process adjustments to the product specification: the fineness targets, the PSD and the strength classes are produced at the minimum energy when the mill operates at the optimized parameters: the optimization campaign of the plant therefore always ends with the energy and the quality accounting, the documented baseline versus the optimized performance, and the reporting of the savings in the kWh per tonne and the quality improvements: the optimization is not complete until the numbers are measured, documented and communicated to the plant management: the energy and the quality accounting is the business language of the grinding optimization.
Get this cement file + the full 931-file package
$249 — one-time purchase, instant download, lifetime access
This file is part of the Complete Cement Technical Package (931 files) available from cementequipment.org. Respective rights holders; library copy for the licensed single user.