Cement Quality Control: Complete Laboratory Guide
Quality control in a cement plant is the discipline that turns chemistry into a product: the continuous measurement of the raw materials, the raw meal, the clinker and the cement, and the feedback of those measurements into the weighing feeders, the kiln and the mill. For most of the twentieth century that discipline was practised in the central laboratory, where samples were taken from different processing points and analyzed every one to two hours, manually or semi-automatically. That approach is now being challenged in modern cement plants by the installation of on-line measurement systems that present decisive advantages over the traditional methods, notably higher frequency and more timely controls, resulting in energy savings and in better and more stable product quality. This complete technical guide, based on the authoritative chapter “On-Line Quality Control Instrumentation in Cement Manufacturing Process” from the Innovations in Portland Cement Manufacturing series held in the Complete Cement Technical Package, explains the four major control areas of the plant, the instruments used in each, their installation, their effectiveness in process control, and their cost justification.
On-line quality control is the industrial answer to a simple statistical fact: a process sampled every two hours is a process controlled every two hours, and in those two hours the kiln can drift, the raw mix can wander and the product can leave its target. The on-line analyzer shortens the loop to minutes: the raw mix analyzer corrects the feeders every five minutes instead of every shift, the kiln feed control keeps the lime saturation factor stable hour after hour, the clinker analyzer reads free lime as the material leaves the cooler, and the cement control verifies fineness and composition at the rate the mill produces it. The result is a plant that burns less energy, produces cement that stays inside its specification, and occupies its laboratory with the deep and confirmatory work rather than with the repetitive screening. This guide gives the full technical picture of that transformation.
1. The Two Philosophies of Quality Control: Central Laboratory Versus On-Line Systems
The traditional cement plant has been controlled from the central laboratory: a sample is extracted at a processing point, conveyed to the laboratory, prepared (dried, ground, fused or pressed) and analyzed, and the result is then interpreted by the chemist and communicated to the control room, where the operators adjust the feeders or the kiln. The cycle time of this loop is on the order of one to two hours, and its information content degrades at every step: the sample may not represent the flow, the preparation may alter the material, and the two-hour delay means the process has been running on yesterday’s answer for most of the interval.
The on-line philosophy inverts the logic: instead of bringing the material to the laboratory, it brings the measurement to the material. A small, dedicated analyzer is installed directly in the process stream, at the mill discharge, on the belt or at the kiln feed, where it measures the material continuously or at intervals of a few minutes and sends its results automatically to the plant control system. The contrast is summarised in the familiar numbers of the industry:
- Frequency: the traditional raw mix analysis is performed every 1 to 2 hours; the on-line analysis is performed every 5 minutes, a factor of twelve to twenty-four in information rate.
- Timeliness: the traditional result reaches the control room after sampling, transport, preparation and analysis delays; the on-line result is available to the control system within minutes of the material passing the measurement point.
- Feedback: the traditional correction is a manual instruction from the chemist to the operator; the on-line correction can be performed automatically by the control system, adjusting the weigh feeders directly.
- Laboratory load: the traditional laboratory spends its capacity on the repetitive screening of the routine samples; the on-line laboratory spends its capacity on the calibration, the referee analysis and the deep investigations that add real value.
- Cost: the modern on-line instruments are cheaper and simpler to operate than the central automatic laboratories that preceded them, and they avoid the pneumatic transport, the automation and the maintenance burden of the fully automatic sample-handling lines.
The two philosophies are not mutually exclusive: the well-run plant keeps its central laboratory for the referee methods, the certification and the 28-day strengths, and operates the on-line instruments for the minute-by-minute steering of the process. The division of labour is the modern compromise, and it is the compromise this chapter documents in practice.
2. The Four Control Areas of the Cement Plant
The complete on-line quality control of a cement plant is organised around the four major areas in which the material composition is created and changed: raw mix control, precalciner control, clinker control and cement control. Each area has its measurement point, its instrument family and its control loop, and together they form the spine of the plant’s quality system:
- Raw mix control: the proportioning of the limestone, clay, iron and silica corrective materials so that the raw meal entering the kiln system has the target oxides (CaO, SiO2, Al2O3 and Fe2O3) and the target moduli (lime saturation factor, silica ratio, alumina ratio); the measurement point is after the raw mill, and the correction loop drives the weigh feeders.
- Precalciner control: the management of the kiln feed chemistry and the burning conditions at the preheater and the calciner, so that the material reaches the kiln fully calcined and chemically stable; the measurement points are the kiln feed, the preheater exit gas and the kiln inlet conditions, and the loops drive the fuel split, the feed rate and the system temperatures.
- Clinker control: the verification of the clinker leaving the cooler, particularly the free lime and the litre weight, which confirm the burning quality and the cooling; the correction loop returns to the kiln fuel, the kiln speed and the cooler operation.
- Cement control: the verification of the finished product, its composition (oxides, SO3), its fineness and its particle size distribution, with the correction loop driving the finish mill feed, the gypsum addition and the separator speed.
The four areas are linked in a cascade: the raw mix determines what the kiln can burn, the clinker quality determines what the mill can grind, and the cement quality determines what the customer receives. The on-line architecture therefore does not control four independent loops but one chain of custody of composition, and the instruments of each area are selected to close the loop at the right speed and the right precision.
3. Raw Mix Control: The Analyzer After the Raw Mill
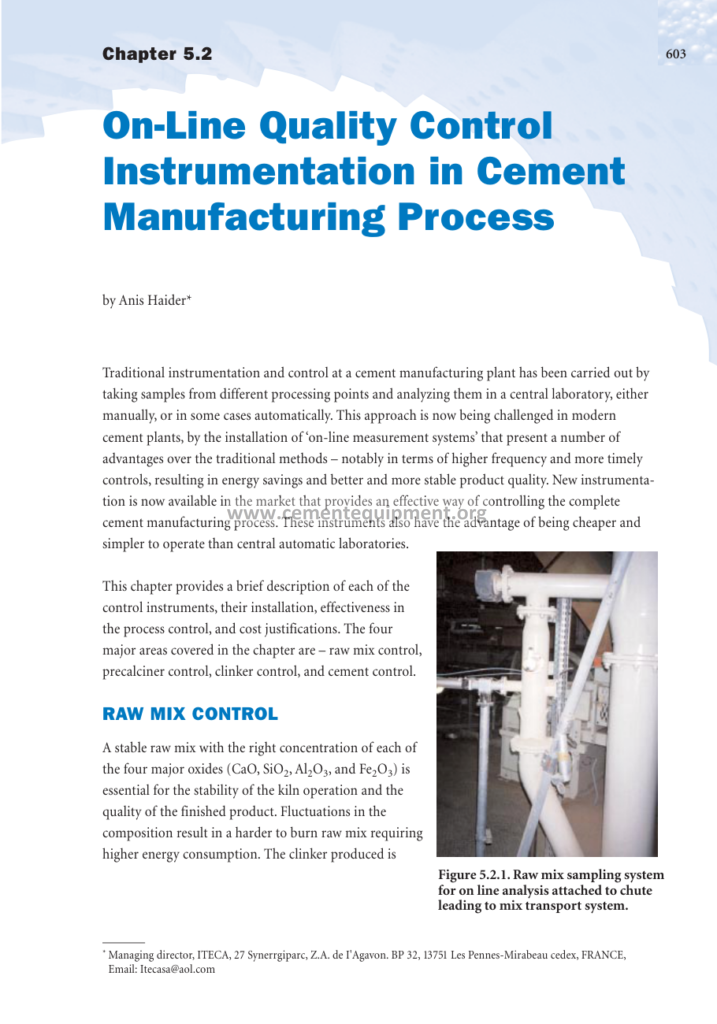
The heart of the raw mix control loop is the on-line analyzer installed after the raw mill, measuring the ground and dried raw meal as it leaves the grinding system and before it enters the homogenising silo or the kiln feed system. The installation point is chosen for a decisive reason: it analyzes the whole composite that will go into the blending silo, including, where possible, all the fines returning from the dust collection system, whose quality and quantity can vary considerably and whose variations are otherwise invisible to the control loop.
- The measurement principle: a representative sample of the raw meal is extracted continuously, ground in a high-efficiency grinder to a fine powder (the working average particle size below 4 microns, which ensures an accurate analysis independent of the raw meal’s original coarseness), and presented to the analyzer.
- The analysis: the automatic on-line analyzer determines the major oxides (SiO2, Al2O3, Fe2O3 and CaO) of the prepared sample, and the results are output directly to the plant control system.
- The correction loop: the control system compares the measured composition with the target, computes the corrections, and adjusts the weigh feeders of the component materials and the additives, closing the loop automatically.
- The performance evidence: comparative testing against the commonly used laboratory techniques (analysis of unground samples, fused bead and mill-and-press preparations) on 20 different raw mix samples from a commercial cement plant in Italy showed that the on-line analysis is consistent with and comparable to the other methods, and that its standard deviation on SiO2 is even lower.
The comparative testing result deserves emphasis because it captures the essence of the on-line method: the raw mix of that plant is rich in quartz, and the unground samples show a high standard deviation for silica because the coarse quartz particles escape the small sample; the on-line analyzer, grinding every sample to below 4 microns, removes this sampling error at its source. The lesson generalises: the accuracy of any analysis is bounded by the representativeness of the sample, and the on-line system’s finest achievement is its sample preparation, not only its detector.
4. Precalciner Control: Stability of the Kiln Feed and the Burning
The precalciner area of the process is the bridge between the raw meal chemistry and the clinker chemistry. The on-line instruments of this area watch the material composition as it enters the kiln system, and the process conditions that transform it: the calcination degree, the gas temperatures, the oxygen and the carbon monoxide of the preheater exit, and the kiln feed rate and fuel split. The control objectives are demanding:
- Kiln feed stability: the kiln feed composition, measured on-line at the kiln feed point, must be held inside the narrow window of the mix design; every excursion in the lime saturation factor changes the burning behaviour and the clinker quality hours later.
- Calcination control: the degree of calcination achieved in the calciner must stay high and stable, so that the kiln receives a uniformly decarbonated feed; the on-line measurements of the exit gas composition and temperature are the indirect windows on this variable.
- Fuel split and oxygen management: the fuel distribution between the precalciner burner and the kiln burner, and the oxygen set points of the system, are adjusted against the measured conditions to keep the burning stable and complete, with the carbon monoxide and oxygen analyzers as the safety and efficiency sentinels.
- Early warning of excursions: the on-line readings detect the drift of the kiln feed (for example a limestone quarry face change or a clay quality shift) hours before it would appear in the clinker, allowing the correction while it is still cheap.
The precalciner control loop is the least visible of the four areas but the most consequential for the energy bill. A kiln feed that wanders in its lime saturation factor forces the operator to overburn or underburn, and either condition wastes fuel; the on-line stabilisation of the feed composition is therefore, in the accounting of the plant, an energy-saving investment as much as a quality investment.
5. Clinker Control: Free Lime and the Burning Verification
The clinker leaving the cooler is the first solid verification of the kiln’s work, and the clinker control area watches it with the instruments that can read the burning quality in real time. The classical variables are the free lime, the litre weight and the clinker composition:
- On-line free lime: modern instruments determine the free lime of the clinker sample automatically at the cooler discharge, using the electrical conductivity method in an ethanolic solution or its on-line derivatives; the result is available in minutes and is fed directly to the kiln control loop.
- Litre weight: the classic clinker density measure on the 5 to 7 millimeter fraction is sampled and measured at the cooler, giving the quickest single-number indication of the burning state: high litre weight with low free lime says a hot, complete burn; low litre weight with high free lime says underburning.
- Clinker composition: where the raw mix control is complete, the clinker chemistry is largely determined by the feed; the on-line clinker check serves as the confirmation of the chemical chain, verifying CaO, SiO2, Al2O3, Fe2O3 and SO3 against the expectations.
- The control response: the free lime reading above the target calls for more fuel, a hotter burning zone or a slower kiln; the readings below target for days suggest overburning and the associated refractory and grinding costs, and the loop returns the operation to the optimum window.
The clinker control area completes the kiln loop at the correct speed: the raw mix loop corrects the chemistry hours before the kiln, the precalciner loop stabilises the burning conditions minute by minute, and the clinker loop verifies the result as it leaves the system. The three loops together hold the clinker inside its window with a precision that the two-hour laboratory sampling could never achieve.
6. Cement Control: Composition, Fineness and Particle Size at the Mill
The fourth area of the on-line architecture watches the finished product: the cement leaving the finish mill, whose composition and fineness are the last variables the plant controls before dispatch. The instruments of the cement control loop are the following:
- On-line X-ray fluorescence (XRF): the elemental analysis of the cement, verified against the target oxide composition, with the automatic sample preparation feeding the analyzer from the mill discharge; the SO3 and the main oxides are the routine readings, and the results close the loop on the mill feed proportioning.
- On-line particle size analysis: laser diffraction instruments measure the full particle size distribution of the cement continuously, reporting the key distribution parameters (percentage below 32 microns, median diameter, and the residues at 45 and 90 microns), which are the direct inputs to the separator speed control loop.
- On-line X-ray diffraction (XRD): where installed, the diffractometer quantifies the phase content of the cement (alite, belite, aluminate, ferrite, sulfate phases), giving the earliest possible indication of the clinker mineralogical changes that strength and setting will later confirm.
- The fineness feedback: the measured fineness and distribution drive the separator speed and the mill feed automatically, holding the Blaine and the residue inside the quality window while the mill production rate is maximised.
The cement control loop is the commercial end of the quality chain, because the cement is what the customer tests. Its on-line instruments do not replace the referee testing of the laboratory; they hold the process so steadily inside its window that the referee testing almost never finds a nonconformance, which is exactly the relationship the modern plant wants between the fast loop and the slow loop.
7. The Instrumentation Palette: A Comparative View
The on-line instrumentation of the cement plant is a palette of techniques, each with its measurement point, its cycle time and its role. The practical landscape is summarised below:
| Instrument | Measured Property | Typical Location | Cycle | Control Loop |
|---|---|---|---|---|
| On-line raw mix analyzer (XRF-based) | SiO2, Al2O3, Fe2O3, CaO of raw meal | After raw mill | ~5 min | Raw mix weigh feeders |
| PGNAA cross-belt analyzer | Elemental composition of bulk material on belt | On the conveyor of the raw materials or kiln feed | Continuous | Quarry blend and raw mix |
| Gas analyzers (O2, CO, NOx) | Combustion and calcination conditions | Preheater exit, kiln inlet | Continuous | Fuel split, oxygen set points |
| On-line free lime analyzer | Free lime of clinker | Cooler discharge | Minutes | Kiln fuel and speed |
| Litre weight sampler | Clinker density of 5-7 mm fraction | Cooler discharge | Per sample | Kiln burning verification |
| On-line XRF of cement | Oxides and SO3 of cement | Finish mill discharge | Minutes | Mill feed and gypsum addition |
| On-line laser particle sizer | Particle size distribution of cement | Finish mill discharge | Continuous | Separator speed, mill feed |
| On-line XRD | Phases of clinker or cement | Lab or mill discharge | Minutes | Burning and mill quality |
The palette is applied selectively: the small plant may install the raw mix analyzer alone and close the other loops with the laboratory, while the large integrated plant runs the full set and reserves its laboratory for the referee functions. The guiding rule of the selection is the same everywhere: the instrument is justified where its cycle time is shorter than the time constant of the variable it controls, and its accuracy is sufficient for the loop it serves.
8. Installation Practice and the Sample System Discipline
The on-line instrument is only as good as its sample system, and the installation practice of the industry is built around this principle. The design and the discipline of the sampling chain include:
- Extraction: the sample is extracted continuously from a well-mixed point of the flow (the mill discharge, the elevator head, the airslide) with a cutter that sweeps the full stream cross-section, because a partial stream sample is a biased sample.
- Preparation: the extracted material is dried, ground to the analyzer’s required fineness (below 4 microns for the raw mix analyzer), and presented as a uniform, representative specimen; the grinding step is what makes the analysis independent of the feed coarseness.
- Return and accounting: the remainder of the sample is returned to the process and the analyzer’s rejects are accounted for in the plant’s mass balance, avoiding both material loss and dusting.
- Calibration: the analyzer is calibrated against the referee methods of the laboratory on a schedule, and the drift between calibrations is tracked so that the control loop does not chase a phantom trend.
- Maintenance: the sample paths are cleaned, the grinding media of the prep unit are renewed and the detector windows are checked on the maintenance plan, because the on-line system runs continuously and its failures are invisible until the process reacts.
The installation location follows the same logic: the analyzer after the raw mill is preferred because it sees the whole composite, including the returning filter dust, rather than a single raw component on the quarry belt. Every relocation of a measurement point in the plant changes what the loop sees, and the instrument-engineering choices documented in the chapter are the accumulated answers of the industry to these positioning questions.
9. The Business Case: Energy Savings and the Cost Justification
The adoption of on-line quality control instrumentation is a business decision, and the cost justification rests on a handful of well-documented effects:
- Energy savings in the kiln: a stable raw mix and a stable kiln feed allow the kiln to run at the optimum burning temperature instead of the safety margin above it; the fuel saving is the largest single benefit of the on-line raw mix control, and it alone can pay for the instrument in a fraction of its life.
- Energy savings in the mill: a clinker of consistent burnability grinds with a consistent specific energy, and the on-line fineness control prevents the overgrinding that the reactive response to quality drift always produces; the electricity saving of the finish department follows the stabilisation of its feed.
- Quality yield: the product stays inside its specification with a smaller margin, which means fewer off-spec silos, fewer re-blends and fewer downgrades, and the certification cost of the plant falls with the nonconformance rate.
- Laboratory economy: the on-line instruments are cheaper and simpler to operate than the central automatic laboratories that preceded them, and the laboratory staff is released for the referee, calibration and investigation work that adds real value.
- Capital and maintenance: the modern on-line analyzers avoid the pneumatic transport systems, the sample robots and the elaborate automation of the automatic central laboratory, with a corresponding reduction in both capital and maintenance cost.
The accounting is not mysterious: the value of the on-line system is the value of the variance it removes, multiplied by the sensitivity of the process cost to that variance. Because the kiln fuel, the mill power and the downgrade costs are all sensitive to the composition and fineness variance, the on-line investment is among the fastest-returning instrument investments a cement plant can make, and the chapter documents the numbers plant by plant.
10. Statistical Quality Control and the On-Line Data Flow
The on-line instruments convert the plant from a specification-testing operation to a statistical process control operation, because they produce the continuous data streams on which the control charts, the capability indices and the drift alarms are built:
- Control charts: the measured oxides, free lime, fineness and SO3 are charted against their targets and their limits, and the control rules trigger the corrections while the process is still inside the window, not after it has left.
- Capability assessment: the six-sigma ratios of the measured properties against the specification limits quantify the plant’s capability on each certified property, and the improvement projects of the plant are prioritised by the weakest capabilities.
- Drift alarms: the trend detection on the on-line data catches the slow drifts (a quarry bench change, a cooler wear, a separator drift) that the single-sample laboratory testing cannot distinguish from the noise.
- Data integration: the on-line results are archived in the plant’s quality database alongside the laboratory referee results and the production data, giving the quality management the complete time series for the investigations, the complaints and the audits.
- The human role: the control room operator, the chemist and the quality manager read the same stream from their different stations, and the discipline of the plant is the discipline of acting on the numbers while they are still numbers, not after they have become claims.
The statistical layer is what converts the instrument investment into the management improvement: the same data that close the minute-by-minute loops also feed the weekly and monthly reviews, so the plant’s quality system becomes a single, coherent, data-driven loop from the quarry to the certificate.
11. Limitations, Pitfalls and the Referee Relationship
The honest engineering view of on-line quality control includes its limitations, and the chapter is explicit about them:
- Sampling representativeness: every on-line measurement is a sample, and the sample can misrepresent the stream; the plant guards this with the extraction design, the prep unit discipline and the periodic validation against the referee methods.
- Drift and calibration: the analyzers drift with the temperature, the humidity and the detector aging; the calibration schedule against the laboratory is the countermeasure, and the calibration records are part of the audit trail.
- Bias between methods: the on-line analysis and the laboratory method do not always agree exactly (the Italian plant comparison showed the agreement within the scatter of the referee methods); the plant establishes the bias and applies it consistently rather than chasing the difference.
- The referee role of the laboratory: the on-line instruments cannot replace the referee testing for certification, disputes and legal evidence; the central laboratory remains the court of record, and the on-line system is the fastest scout, not the judge.
- Maintenance dependence: the on-line system runs continuously and its failures are silent; the plant’s maintenance plan and the backup sampling scheme decide whether the instrumentation adds reliability or a new failure mode.
The mature plant treats the on-line system as one layer of a two-layer quality architecture: the fast, dense, automatic layer of the on-line instruments and the deep, rigorous, manual layer of the central laboratory. Each layer keeps the other honest, and the total quality system is stronger than either layer alone.
12. Frequently Asked Questions
How often should raw mix be analyzed in a modern plant?
With on-line instrumentation, every 5 minutes; without it, traditionally every 1 to 2 hours in the central laboratory. The five-minute cycle allows the weigh feeders to be corrected automatically before the process can drift, which is the difference between controlling the raw mix and auditing it.
Why is the analyzer installed after the raw mill and not on the quarry belt?
Because the point after the raw mill sees the whole composite that will enter the blending silo, including the returning filter dust whose quality and quantity vary considerably. A quarry belt measurement sees one component; the mill discharge measurement sees the mixture that actually matters for the kiln.
Why must the raw mix sample be ground below 4 microns for the analysis?
Because the analysis must represent the bulk of the material, and coarse particles escape small samples. In a quartz-rich raw mix, the unground samples show a high standard deviation for silica precisely because of the coarse quartz particles; grinding the sample below 4 microns removes this sampling error at its source and makes the on-line results comparable with the best referee techniques.
Can on-line instruments replace the central laboratory?
No: they replace the repetitive screening work of the laboratory, but the laboratory remains essential for the referee methods, the certification, the calibration of the on-line instruments and the investigation work. The modern division of labour is the on-line fast loop for steering the process and the laboratory slow loop for judging the product.
What is the payback logic of an on-line raw mix analyzer?
The payback comes primarily from the kiln fuel saving achieved by stabilising the raw mix and the kiln feed (the kiln burns at the optimum temperature instead of the safety margin), secondarily from the mill power saving on the more consistent clinker, and thirdly from the reduction of downgrades and off-spec silos. The combined savings are typically recovered within a fraction of the instrument’s service life.
How is the on-line free lime of the clinker measured?
The automatic free lime analyzers use the conductivity of the clinker dissolved in an ethanolic solution (the method family of the classic laboratory conductivity determination) implemented in an on-line sample and measurement cycle at the cooler discharge, reporting the free lime within minutes so the kiln loop can respond while the material is still in the system.
13. Conclusion and Summary
The on-line quality control of the cement plant is the industrial application of a simple idea: measure the material where it flows, measure it often, and feed the measurement back into the process automatically. The four control areas of the plant, raw mix, precalciner, clinker and cement, each close their loop with instruments that have been proven in decades of commercial service: the raw mix analyzer with its sub-4-micron sample preparation correcting the weigh feeders every five minutes, the gas and temperature analyzers stabilising the precalciner, the free lime and litre weight analyzers verifying the clinker at the cooler, and the XRF, XRD and laser particle size analyzers holding the cement inside its window at the mill.
The benefits are quantitative and documented: energy savings in the kiln and the mill, more stable and better product quality, lower downgrade and certification costs, and a laboratory released from repetitive screening for the deep referee work. The limitations are equally clear and manageable: sampling representativeness, calibration drift, method bias and maintenance dependence, all controlled by the two-layer architecture of the fast on-line loop and the rigorous central laboratory. The plant that installs the on-line architecture does not abandon its quality laboratory; it completes it, and the combination is the quality system of the modern cement industry. The complete documentation of the instruments, the installations, the performance data and the cost justifications is available in the Complete Cement Technical Package.
Get this cement file + the full 931-file package
$249.99 — one-time purchase, instant download, lifetime access
This file is part of the Complete Cement Technical Package (931 files) available from cementequipment.org. Respective rights holders; library copy for the licensed single user.