
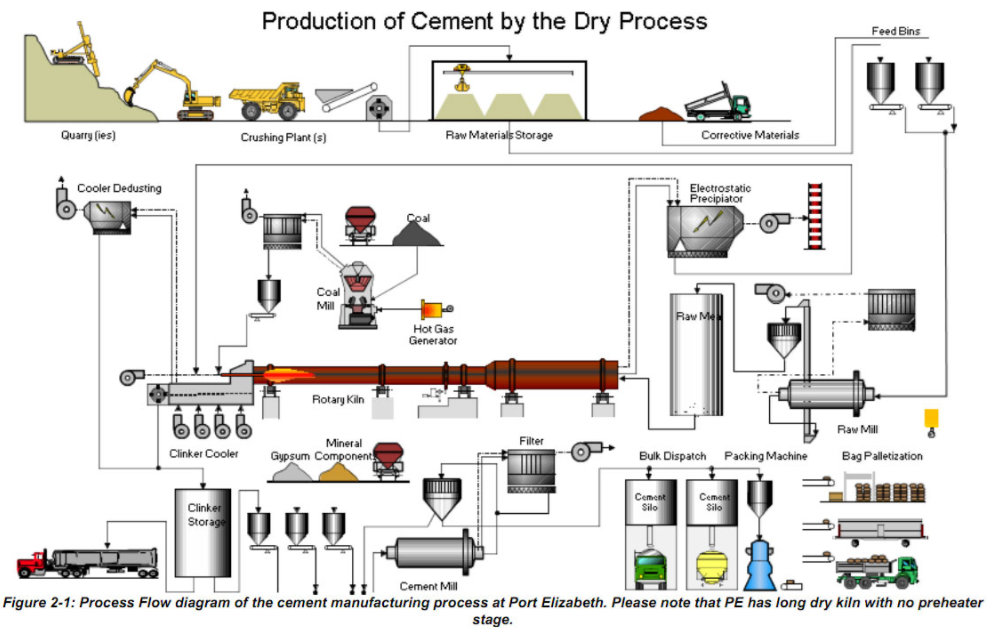
For the manufacturing sequence in order, read the nine-step cement manufacturing flowchart. This page focuses on engineering measurements and equipment relationships.
Quick engineering answer
A cement manufacturing flow chart is most useful when each process block is linked to the material transformation, key operating variables and downstream consequence. Follow the process from quarry and raw preparation through pyroprocessing, clinker cooling, finish grinding, storage and dispatch, and use the flow chart as a system map rather than a list of isolated machines.
Full Technical Guide
Cement Manufacturing Process Flow Chart – Full Technical Overview
A cement manufacturing process flow chart starts with raw material extraction, proceeds through crushing, raw‑meal grinding, preheating, calcination in the kiln, clinker cooling, final grinding, and ends with storage or dispatch. Each block is linked by material balances, temperature zones, and energy flows that define the plant’s heat‑balance and product quality.
How the Process Works – Key Mechanisms and Root Causes
The cement production line is a tightly coupled series of thermal, mechanical, and chemical operations. Understanding the root cause of performance deviations requires a grasp of the underlying mechanisms:
- Raw-material preparation: Limestone, clay and corrective materials are extracted, crushed, sampled and proportioned. Verify moisture, chemical variability and particle-size distribution against the plant’s actual raw-mix design.
- Raw-meal grinding and homogenisation: A vertical roller mill or ball mill prepares raw meal to a fineness suited to kiln burnability and raw-material characteristics. Evaluate separator settings, residue or particle-size data, feed chemistry and blending performance together; no universal separator cut size is appropriate.
- Preheater and precalciner: Kiln exhaust and tertiary air transfer heat to the meal; a precalciner, where fitted, performs a substantial share of calcination before the rotary kiln. Compare temperature, gas flow, pressure drop and fuel distribution with the specific plant heat balance.
- Kiln thermal zones: Drying, calcination, transition and burning conditions depend on kiln configuration and feed. Clinker mineral formation depends on chemistry, temperature history, residence time and atmosphere; verify using process trends and clinker quality tests rather than generic temperature bands.
- Clinker cooling: The cooler removes heat from clinker and recovers hot air for combustion. Cooling conditions influence clinker mineral development and heat recovery, but free-lime control also depends on raw-meal chemistry and burning conditions. Use cooler-specific air-flow, bed-depth, temperature and performance data.
- Final grinding and blending: Clinker is ground with a controlled calcium-sulfate addition and any other permitted cement constituents. Set addition rates using constituent assays, cement specifications and verified mill performance; assess grinding energy in kWh/t on a clearly defined electrical boundary, alongside Blaine, residue or particle-size distribution.
- Quality-control loops: Representative sampling, validated laboratory analysis and suitable online instruments support raw-mix and clinker control. Interpret lime saturation factor, silica modulus, alumina modulus and free lime against the actual cement product, kiln design and approved operating envelope; do not apply universal alarm thresholds.
- Alternative fuels and emissions: Alternative-fuel properties can change heat release, combustion stability, ash chemistry, volatile-element cycles and emissions. They do not inherently create false air; assess leakage separately using measured gas and oxygen balances.
Plant-specific operating measurements to verify
The following measurements are diagnostic inputs, not universal operating limits. Record actual values and compare them with the plant’s approved process baseline, equipment specifications, laboratory methods and product requirements.
| Measurement | Verification basis |
|---|---|
| Raw-material moisture and raw-meal fineness | Representative samples, validated laboratory methods and raw-mill design baseline |
| Preheater and precalciner temperatures and pressure drops | Calibrated trends, gas-flow context and OEM/plant operating envelope |
| Kiln burning conditions and residence indicators | Fuel, feed, draft, kiln speed, temperature evidence and clinker mineralogy/free lime |
| Specific thermal consumption (GJ/t clinker) | Consistent fuel-energy accounting and clinker production boundary |
| Lime saturation factor and other raw-mix moduli | Validated chemical assays and approved clinker-quality targets |
| Calcium-sulfate addition and finished-cement SO3 | Actual dry-basis constituent flows, sulfate assays and applicable cement specification |
| Grinding specific electrical energy (kWh/t cement) | Measured power and throughput using the same circuit boundary |
| Cooler air flow and clinker discharge temperature | Cooler design, calibrated measurements and verified heat-recovery performance |
Step‑by‑Step Guide to Building and Interpreting a Cement Process Flow Chart
Creating a useful flow chart goes beyond drawing boxes; it must embed the engineering logic that drives plant performance. Follow these steps:
- Define the scope: Decide whether the chart will cover the entire plant (raw‑material to dispatch) or focus on a subsystem (e.g., kiln‑preheater). Include all heat‑exchange surfaces, material streams, and control loops relevant to the scope.
- Gather baseline data: Collect recent plant data – raw‑material composition, kiln temperature profile, fuel mix, mill power, and product quality indices. Use the parameter table above as a checklist to ensure no critical variable is omitted.
- Map material flows: Use standard symbols – rectangles for unit operations, arrows for material streams, and diamonds for decision points. Label each arrow with the key property (e.g., “Raw-meal: measured fineness and moisture at the specified sampling point”).
- Integrate energy flows: Add heat‑balance arrows showing recovered heat from the clinker cooler to the preheater, and the contribution of alternative fuels. Indicate specific heat consumption next to the kiln block.
- Insert control loops: Show where on‑line analyzers (XRF, XRD) feed back to the raw‑meal mill, and where kiln temperature controllers adjust fuel and air. Use a different colour or line style to distinguish control signals from material streams.
- Highlight critical quality nodes: Mark the points where LSF, silica ratio, and free‑lime are calculated. Include a small table or note beside the clinker block summarising acceptable ranges.
- Validate with plant personnel: Walk the chart through with the shift supervisor, mill operator, and kiln engineer. Verify that each arrow matches the actual piping or conveyor layout and that the numeric ranges reflect plant‑specific limits.
- Use the chart for diagnostics: When a quality deviation occurs (e.g., high free‑lime), trace the flow chart backward: check raw‑meal moisture, preheater temperature, and kiln inlet temperature. The visual map quickly isolates the most probable root cause.
- Maintain version control: As plant upgrades (e.g., new pre‑heater cyclone or alternative‑fuel system) are implemented, update the flow chart and archive the previous version. This practice preserves a historical record for performance trend analysis.
Frequently Asked Questions
What is the purpose of the pre‑heater and pre‑calciner in the flow chart?
The preheater recovers heat from kiln and calciner exhaust to warm and partly calcine the raw meal. In a precalciner system, fuel and combustion air support additional calcination before material enters the rotary kiln, reducing the calcination duty inside the kiln. Evaluate heat consumption and alternative-fuel capability against the actual process design, combustion stability and clinker-quality results.
How does the separator cut size affect clinker burnability?
Raw-meal fineness can affect reaction rates and burnability, but separator cut size is equipment- and material-specific. Check measured raw-meal residue or particle-size distribution, chemistry, kiln performance and raw-mill power before changing classification settings. Excessive fineness may increase grinding energy without a proportional kiln benefit.
Why is rapid clinker cooling essential, and how is it represented in the flow chart?
Controlled clinker cooling helps preserve the desired clinker mineral assemblage and recover sensible heat. Free lime is primarily evaluated in relation to raw-mix chemistry, burnability and burning conditions; cooling alone does not establish free-lime control. Show the cooler as a heat-recovery block supplying secondary air to the kiln and, where configured, tertiary air to the calciner.
Can alternative fuels be introduced without redesigning the flow chart?
Update the flow chart to show each actual alternative-fuel receiving, preparation, dosing and injection point, which may be at the main burner, calciner or another OEM-approved location. Identify the relevant combustion-air, fuel-ash, heat-balance, gas-composition and emissions-control interfaces. Assess false-air ingress separately from alternative-fuel addition; do not imply that a new fuel necessarily creates a false-air leak. Validate the revised flows and controls against the installed plant design and its approved safety and environmental requirements.
What are the typical signs of cyclone blockage, and how does the flow chart help locate it?
Possible preheater-cyclone restriction indicators include a changing stage differential-pressure pattern, unstable draft, abnormal temperature distribution, meal-flow disturbance or reduced throughput; none is conclusive alone. Compare calibrated pressure and temperature trends across the affected stages with a stable operating baseline, accounting for gas flow, fuel/feed changes, sensor faults and buildup elsewhere. Mark actual measurement locations on the flow chart. Suspected hot-material blockage requires the plant’s approved isolation, exclusion-zone and clearing procedure; never approach or open equipment solely on the basis of a pressure alarm.
How often should the process flow chart be reviewed?
Review the flow chart under the site’s document-control schedule and whenever a material process or equipment change occurs, such as a new fuel source, significant ductwork modification or grinding-system upgrade. Record the revision and verify it against the actual installed configuration and approved operating limits.